Download
1 / 29
300 likes | 524 Vues
Learn how firms calculate revenue, analyze demand curves, and optimize profit through marginal revenue and cost. Enhance your economic knowledge and grasp the fundamentals of a firm's revenue structure.

E N D
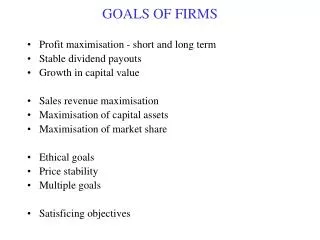
The Firm’s Revenue THE OBJECTIVES OF FIRMS
Lesson Objectives • Understand how to calculate a firm’s revenue • Understand that if a firm has a horizontal demand curve that curve is also the marginal revenue curve • Understand that a firm with a downward sloping demand curve has a marginal revenue curve sloping down beneath it • Understand that a profit maximising firm will produce where marginal revenue equals marginal cost
Connector • In pairs brainstorm on this statement and write your answers – • “The traditional view of a firm is minimising its costs and maximising its revenue in order to maximise its profit”
Big Picture • You will study the firms’ revenue curves in greater detail and you will appreciate that economists are interested in marginal amounts – both marginal costs and marginal revenue. • You will learn how to handle the calculations and the importance of the profit-maximising concept of marginal costs equalling marginal revenue and the difference between normal and supernormal profit. • In short you will become familiar with the economists’ terms in the theory of the firm.
Big Picture • To arrive at the learning outcomes you will do the following: • Listen to teacher demonstrations on PPP • Draw graphs • watch VIDEO • ‘Stretch and challenge’ Questions • Group work • Independent work • Class discussion • Short presentation • Demonstration on the board • Pair marking • Advise on examiner’s tip
Lesson Outcome • Understand the difference between average, total and marginal revenue • Be able to explain why profit maximisation occurs where marginal revenue equals marginal cost
Key terms • Profits • Total revenue • Average revenue • Marginal revenue • Total profit • Normal profit • Profit maximisation • Supernormal profit • Sub-normal profit • Entrepreneur.
The Firm’s RevenueIn a Perfectly Competitive Market • A firm’s total revenue = Units of Output Sold × Price. • If all units are sold at the same price the revenues are as shown in Table 1 below. • Both the average revenue (AR)and the marginal revenue (MR) are constant as the same priceis charged for the product. • As the total revenue (TR) is either pricemultiplied by units soldoraverage revenuemultiplied by units soldthen price and average revenue are one and the same. • The marginal revenue is the addition to total revenue from the production of one extra unit, • so, in Table 1, unit 2 adds £500 to the firm’s revenue making the total revenue £1,000.
Activity • Activity – Using Table 2.1, on Page 17, Calculate the TR, AR, & MR and Construct a Graph to indicate them. Describe the pattern of the figures and the curves in a Perfectly Competitive Market.
In an Imperfect Market • If price per unit changes the Marginal Revenue changes, as shown in Table 2. • In the table above, the firm is facing a downward sloping demand curve where more units are sold as the pricefalls. • Average revenue and price remain the same but the marginal revenue is less than the average revenue. • The explanation of this is that as more units are sold the price of all units has to be reduced.
To calculate Marginal Revenue (MR) subtract from the Total Revenue (TR) the Total Revenue earned from the previous unit.
Table 1 and 2 are shown in the Figure below. • The diagram above shows the situation in Table 2 where the MR is shown as sloping downward beneath the AR. • At unit 3 the price or AR is £410 but the MR is £330 (£1,230 - £900)as the sale of the third unit has added £330 to the TR. • The rectangle indicated by the area £410 x 3 shows the TR for the sale of 3 units while AR for 3 units is shown by point ‘X’ on the demand curve. • The diagram above shows the situation in Table 1 where the firm sells all the quantity produced at the same price. • The demand curve is shown as horizontal at a price of £500, which means that all units produced by the firm can be sold at this price. • The demand curve also represents the AR and MR as they are also equal to £500. • The rectangle indicated by the area £500 × 5 shows the TR for the sale of 5 units, £2,500. • Note that ARequalsTR ÷ no. of units sold, (£2,500 ÷ 5 = £500), so price and AR are one and the same, i.e., the price is the AR. • TR is shown in the diagram by an area whereas AR is indicated by any point on the Demand Curve
This Figure indicates the relationship between total, average and marginal revenue • At a price of £60 the TR is £12,000 (AR x units sold = £60 x 200) while the MR is £40. • At a price of £40 the TR is £16,000 (£40 x 400). TR is maximised at this point as MR is zero. • At a price of £30 TR has fallen to £15,000 as MR is negative and extra units produced beyond 400 have reducedTR. In the Figure above, as pricefalls between A and B, the TRincreases, which indicates that demand over this part of the curve is elastic. If price is reducedbelow B, TR falls indicating that demand over this part of the curve is inelastic.
Remember that price equals average revenue (P=AR) and that the terms may be used interchangeably.
Activity • Activity – Using Table 2.1 on page 18, Calculate the TR, AR, & MR and Construct a Graph to indicate them. Describe the pattern of the figures and the curves in a Perfectly Competitive Market.
2. Profit – Maximising OutputIn the traditional theory of the firm, firms will always try to maximise profits and firms will use the Marginal Quantity as a guide to where this is achieved From the this Figure we can see that: • If one unit is produced then the MC of that unit is £20, while the MR is £50. this unit adds more to revenue than to cost and should be produced. • With two units produced, the MC increases to £30, while MRremains at £50, but as it adds more to revenuethan cost it should be produced. • Units four adds £80 more to cost and £50 to revenue; the firm will not produce it as it would add more to coststhan it does to revenue. • Units up to number threeadd more to revenuethan cost and it pays the firm to produce them as the extra outputadds to Total Profit. • But output beyond the third unit adds more to coststhanrevenue and will cause profits to fall. • With the production of the third unit MR and MC are equal but included in cost is what economists refer to as Normal Profit, and so it pays the firm to produce unit 3.
Normal Profit • Normal profit is a return to the firm, which is just sufficient to ensure that it will continue to supply its good or service, i.e., MR =MC where MC is rising • If the level of profit earned is below that of markets with equal risks the firm will transfer its resources to another market where normal profit can be obtained. • Any firm wanting Profit Maximisation will produce up to the point where MR= MC. As long as MR > MC • Depending on actual market conditions firms may earn • Supernormal Profits (more than that required to ensure supply of the good) • Normal Profit (just sufficient to ensure supply of the good) or • Sub-normal Profit (less than that required to ensure supply of the good).
Remember that when revenue equals costs firms are making normal profit.
The Economist’s View of Profits • Normal profit is a return that covers the opportunity cost of all factors used in the process; the amount necessary to keep a factor in its present occupation. • Supernormal or abnormal profit implies a return over and above normal profit. • Super normal profits can be seen as providing an incentive to firms to enter an industry. They signalentrepreneurs to allocate more factors and therefore are important in allocating scarce resources to areas where they are required. • Supernormal profits may also indicate a lack of competition in the industry. • Negative or falling profits may indicate that oversupply is taking place and firms will leave the industry and allocate their factors elsewhere.
ACTIVITIES A firm faces a horizontal demand curve where the market price is £25. The table below indicates the firm’s total costs at each level of output. Redraw the table and calculate the marginal costs . Construct a graph to indicate the profit-maximising output. Explain under what circumstances the firm would produce six units.
Answers • Graph should show horizontal demand curve (labelled as D = AR = MR) at price £25. Profit maximising output occurs where MR = MC, that is, 6 units. • The firm would produce six units, that is, the profit maximising level of output, if it was actually able to calculate the profit-maximising level of output, and had profit maximisation as its objective. In reality, calculating profit is not necessarily very easy, and firms can have other objectives.
The objectives of firms Innocent’s objectives Learning objectives: • appreciate that in addition to profit maximisation, firms often have a range of other objectives that they want to satisfy • understand that firms can grow in different ways. Scenario • Innocent Drinks make smoothies, juices and ‘veg pots’, and are characterised by their ethical slant on everything what they do. At just 10 years old, Innocent now has a total revenue of around £100m. The Innocent ‘ethos’ is built around the four main principles advocated by its founders: • ethical purchasing • reducing/offsetting carbon emissions • recycling • charitable giving. These principles govern every decision made, from recruitment through to the purchasing of bananas and advertising campaigns. Richard Reed, one of Innocent’s founders, has said that ultimately, Innocent’s objectives are to do with growth and profit. Some might think that Innocent’s ethical stance would cause these objectives to suffer. However, many consumers buy Innocent products over the alternatives because of their inbuilt ethical approach, allowing them to feel like ‘do-gooders’. So, Innocent’s employees have to be both commercially minded, and altruistic – not an easy combination to find! For the moment, Innocent’s founders are pursuing expansion in the European market, but are to work on global expansion when the time is right. As yet, there is no clear way forward; Adam Balon, one of the original founders, recently said that a sale of the company, a partial issue of publicly traded shares or simply continuing to grow organically were all options being considered. Achieving internal growth, however, is becoming more difficult as Innocent’s founders are having to delegate responsibilities, such as marketing and recruitment, that they have previously handled themselves. Questions • Explain what is meant by ‘total revenue’. • Examine the importance of profit for companies. • Using examples from the case study, and your own knowledge, outline other possible objectives that a company such as Innocent Drinks might adopt. • Outline reasons why achieving organic growth can be difficult for a company such as Innocent. • Comment on the statement that ‘expansion via the sale of Innocent is the best way for the company to grow’.
Data Response Question 1a: • Marginal in economics refers to small increments. Many large companies would not be interested in the ‘marginal’ mines because it would incur significant cost to generate any revenue, that is, it would be small part of their overall profit. • However, for a small company, such mines could generate enough profit.