Download
1 / 55
550 likes | 566 Vues
This abstract outlines the Non-imaging Air Cherenkov Technique used in the Tunka-133 array and the SCORE project for cosmic ray origin and gamma-astronomy studies. It covers the Tunka-133 array's construction, deployment, and goals, such as energy spectrum and mass composition studies in the high-energy range. The SCORE project focuses on searching for gamma-quanta above 30 TeV and studying cosmic rays up to 10^18 eV. The advantages of Cherenkov technique include good energy and angular resolution, with low deployment costs. Various parameters, such as quantum efficiency, light attenuation, and energy determination methods, are discussed as essential for accurate measurements in these studies.

E N D
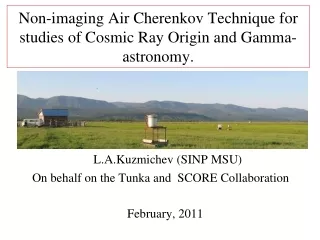
Non-imaging Air Cherenkov Technique for studies of Cosmic Ray Origin and Gamma-astronomy. L.A.Kuzmichev (SINP MSU) On behalf on the Tunka and SCORE Collaboration February, 2011
Abstract • Non-imaging Air Cherenkov Technique is described by using the Tunka-133 array and the SCORE project as an examples. The Tunka-133 is a 1 km2 array started to operate in autumn of 2009 in the Tunka Valley, 50 km from the Lake Baikal. The main goal of the array is to study energy spectrum and mass composition in the energy range of 1015 -1018 eV. • SCORE is a project of 10 km2, low threshold array. The main goal is to search of gamma-quanta with energies above 30 TeV (origin of cosmic rays) and to study cosmic rays with energies of up to 1018 eV. It is planned that the first stage of SCORE ( 1-2 km2 ) will be installed in the Tunka Valley for joint operation with the Tunka-133 array.
OUTLINE • Non-imaging Air Cherenkov Technique 2. Tunka-133: construction and deployment. 3. Results after first season. 4. Plan for the Tunka-133 upgrading. • SCORE project. 6. Cherenkov Technique at Mounting Level
Atmosphere as a huge calorimeter ForEe >25 MeV Ve > C/ n – light velocity in air P, A Cherenkov light Q tot N(x) dx ~ E 20-30km Lateral Distribution Function E (PeV) = 0.4 Q(175) ph· ev-1 cm-2 Photons detectors
Advantage of Cherenkov Technique: 1. Good energy resolution - up to 15% 2. Good accuracy of Xmax - 20 -25 g/cm2 3. Good angular resolution - 0.1 – 0.3 deg 4. Low cost – Tunka-133 – 1 km2 array: 0.5 106 $ ( construction and deployment) + 0.2 106 $ ( PMTs) Disadvantage: 1. Small time of operation ( moonless, cloudless nights) – 5-10%
Light background Energy threshold of Cherenkov array • S– area of PMT photocathode • - quantum efficenty • Qph(R) –Cherenkov light flux • T - duration of pulse • ( 20 –40 нс) • - angle of view • Iph– light night background • 2.108ph/cm2 s S•Qph(175)• Signal 3 = noise •S•Iph•T Qph(175 ) = C · E Iph• •T Eth~ S• forS=0.1 m2 и0.1 : Eth 100 TeV
Usage of Cherenkov Light Lateral Distribution Function (LDF) for the Reconstruction of EAS Parameters LDF from CORSIKA Q(R) = F(R, p) (only one parameter) Experimental data fitted with LDF light flux at core distance 175 m - Q175 Energy P = Q(100)/Q(200) Xmax steepness of LDF
Cherenkov light density at 175 m from the shower core CORSIKA Energy determination: E = C· Q(175)094 Lg( E/E0) Lg(Q(175) / ph· ev-1 cm-2 ) Energy resolution ~ 15%
Absolute calibration of energy measurement E Q(175) • 1. To measure light flux with good accuracy we need to know PMTs quantum efficiency and light attenuation. Difficult but possible. • 2. Another approach – how to avoid measurement of quantum efficiency and light attenuation - experiment QUEST at Gran-Sasso.
Experiment QUEST – QUSARS at EAS-TOP • EAS-TOP array at Gran-Sasso (Italy) – Ne and core position. Cherenkov detectors – LDF and P =Q(100)/Q(200) For P we not need to know the absolute value of quantum efficiency PMT QUASAR-370 ( 37 cm photocathode diameter) Used in Baikal Neutrino experiment NT200 and Tunka-25
No dependence from Hadronic model p
Model independent intensity of CR flux from QUEST experiment. Tunka experiment is normalized to this intesity.
Xmax determination • Steepness of LDF: Xmax = F( P) • Width of light signal : Xmax = F( τ ) • Shape of Cherenkov front : Xmax = F(a) • ( not used up to now) a
Xmax by steepness LDF Hmax (km ) = 14.07 – 2.33 · P
X max by using WIDTH DISTANCE FUNCTION (WDF) X =X0 cosXmax ( X0 – depth of the atmosphere lg(R) WDF (R, (400 ) 400 Dependence ofX(X0 cosXmax)from (400) . Dependence of pulse duration from the distance from the core for EAS with different Xmax ( CORSIKA + apparatus distortion) ( 1 . X= 154 гсм2 , 2 X= 555 гсм2, 3. X=877 гсм2)
Tunka-133 – 1 km2 “dense” EAS Cherenkov light array Energy threshold 1015 eV Accuracy: core location ~ 6 m energy resolution ~ 15% Xmax < 25 g∙cm-2 S (Tunka-133) = 30 S (Tunka-25)
Search for the Acceleration Limit of Galactic Sources IceTop IceCube • - Energy range 1016-1018 eV demands: • 1 km² with spacing smaller than that at Auger • complementary techniques • - KASCADE-Grande terminated • - IceTop/IceCube 100% ready • Tunka-133 (calorimetric) in operation • NEVOD-DÉCOR in operation • Auger low energy extension 80% ready • SCORE planned • LHAASO planned Tunka-133 ? CR from SNR CR from AGN
Tunka-133: 19 clusters, 7 detectors ineach cluster Optical cable DAQ center Cluster Electronic box PMT EMI 9350 Ø 20 cm 4 channel FADC boards 200 MHz, 12 bit
Array deployment Optical cables Detectors TestingPMTs
4 channel FADC Cherenkov light pulses at two detectors of the cluster at core distance~ 700 m 1. ADC AD9430, 12 bit, 200 MHz 2. FPGA XILINX Spartan-3 t ( 5 ns)
Angular sensitivity Optical detector of Tunka-133 PMT EMI 9350 Ø 20 cm
Firstseasonof operation: November 2009– March 2010 • 286hoursof good weather . • 2106 eventswithenergy 1015 эВ. • 10 events duringevery night withnumber of hitted detectors more than 100. 50 detectors 1016 eV Trigger counting rate during one night. Distribution of the number of hitted clusters in one event.
Energy: 2.01017 eV zenith angle : 12.6 ° Example of event 125 detectors Core position: LDF -method WDF -method R lg ( I light )
Lg Qexp (R ) Lg (R ) LDF WDF Thershold B A .A– Fitting experimental points with LDF B – Fitting of ( R) with Width – Distance Function.
Combined spectrum Tunka 25( ) plus Tunka 133 ( ) 182 event 353 g1 g1 = 3.2 g2 = 3.0 g2
Good pointing for the existing of “ bump” 353 events 4.2 277
Tunka-133 Gamma
Plan for Tunka-133 upgrading • Far distant clusters for encreasing effective area - Scintillation muon counters E0 , Xmax ( from Tunka-133 ), Nµ - Low threshold array
. 6 additional clusters ( 42 detectors) 1 km Increasing Effective Area in 4 times for energy more than 1017 eV Statistics in 2012 ( > 1017 eV) : 600 (inner events) + 800 (out events) All: 1400 events In operation
SCORE project – wide-anglegamma-telescopewith area 10 -100 km2 and threshold30 тэВ(M.Tluczykont et al , ArXiv: 0909.0445) SCORE: Study for Cosmic ORigin Explorer Increasing area of PMT with Winston cone First SCORE Station will be tested at Tunka in this summer
Distance between station - 100 -200 m Angular resolution: < 0.1°
The Physics Motivations: Cosmic Ray Origin Search for the Pevatrons: gamma-quanta with energy >100 TeV only from hadronic mechanism Propagation and Absorption of gamma-rays ( photon/axion conversion or Lorentz violation) Dark matter Axion as CDM candidate
Cherenkov Technique at Mounting Level. For good energy resolution Xmax < X0 ( depth of Atmosphere ) – “thick calorimeter”
Cherenkov Technique at Mounting Level • Low energy • E < 200-300 TeV • 2. Large zenith • Angle > 45°
LDF for 100 TeV gamma (zenith angle = 0°) Difference seems not too dramatic but should take into consideration Tunka level 2 times LHAASA level
Xmax distribution For proton with energy 1017 eV X0 / cos 45 X0
Very large area of muon detectors at LHAASO gives: • High factor of gamma-hadron separation for • SCORE –like array. • Essential increasing of the accuracy • of mass composition study at 1016 -1018 eV • 3. Good sensitivity to ultra high energy gamma radiation
Muon numbervs. Xmax Fe, Si p ( 500 events) He ( 500 events) Si (500 events) Fe ( 500 events) AIRES 2.8.4a QGSJET-II Eµ > 1 Gev, θ = 0° Nµ /Nµ = 10%, Xmax = 20 g/cm2 p, He lgNµ Xmax Xmax - 600 lgNµ (corr)= lgNµ - lgNµ 1500
766 г/см2 675 г/см2 Log Nmu
Conclusion • 1.Non-imaging Air Cherenkov Technique is rather well understood technique. • High energy resolution – 15 -20%, high accuracy for Xmax - 20 g/cm2 • 2. The TUNKA-133, presently the largest Air Cherenkov Array in the world, • is operating now and provides very interesting results. • The upgrading of the array will start in 2011 • The SCORE is very perspective project for Very High Energy • gamma-ray astronomy and Cosmic Rays physics. • 4. Operation of SCORE and TUNKA like arrays (for large zenith angles) • at the LHAASA altitude seems very interesting.
Tunka Collaboration S.F.Beregnev, N.N.Kalmykov, E.E.Korosteleva, V.A.Kozhin, L.A.Kuzmichev, M.I.Panasyuk, V.V.Prosin, A.A.Silaev, A.A.Silaev(ju), A.V.Skurikhin, I.V.Yashin, A.V.Zablotsky –Skobeltsyn Institute of Nucl. Phys. of Moscow State University, Moscow, Russia; N.M.Budnev, A.V.Diajok, O.A. Chvalaev, O.A.Gress, A.V.Rjchanov, A.V.Korobchebko, R.R. Mirgazov, L.V.Pan’kov, Yu.A.Semeney,A.V. Zagorodnikov –Institute of Applied Phys. of Irkutsk State University, Irkutsk, Russia; B.K.Lubsandorzhiev, B.A. Shaibonov(ju) –Institute for Nucl. Res. of Russian Academy of Sciences, Moscow, Russia; V.S.Ptuskin –IZMIRAN, Troitsk, Moscow Region, Russia; Ch.Spiering, R.Wischnewski –DESY-Zeuthen, Zeuthen, Germany; A.Chiavassa –Dip. di Fisica Generale Universita' di Torino and INFN, Torino, Italy. D. Besson, J. Snyder, M. Stockham Department of Physics and Astronomy, University of Kansas, USA
Registration of Cherenkov light from EAS E0~Q(175 m)Ln(1/A) ~ Xmax θ, φ Xmax Methods of Xmax measurement: 1. Steepnes of LDF: P ~ Hmax, km Hmax=(T0/grad(T)((Xmax cosθ/X0)C/grad(T) - 1)–Harr)/cosθ 2. Signal duration ~ ΔX g/cm2 ΔX = X0/cosθ – Xmax X0