Download
1 / 68
680 likes | 710 Vues
Learn about the impact of unemployment benefits extension on job seekers and different types of unemployment. Understand inflation calculation methods and its effects on the economy.

E N D
Chapter 7The Macroeconomy: Unemployment, Inflation, and Deflation
Introduction In 2009, Congress used general taxpayer funds to extend the length of unemployment benefits from 26 weeks to 52 weeks. A number of economists have suggested that this policy change has caused an increase in the number of people unemployed. In this chapter, you will learn how unemployment is defined as well as how extending unemployment benefits many have contributed to the number of people counted as unemployed.
Learning Objectives • Explain how the U.S. government calculates the official unemployment rate • Discuss the types of unemployment • Describe how price indexes are calculated and define the key types of price indexes
Learning Objectives (cont'd) • Distinguish between nominal and real interest rates • Evaluate who looses and who gains from inflation • Understand key features of business fluctuations
Chapter Outline • Unemployment • The Major Types of Unemployment • Full Employment and the Natural Rate of Unemployment • Inflation and Deflation • Anticipated versus Unanticipated Inflation • Changing Inflation and Unemployment: Business Fluctuations
Did You Know That ... • Between 2008 and 2010, the number of people gainfully employed in the U.S. declined by nearly 9 million? • Since then, more than 2 million of these people have regained positions in the workplace. • Of the remainder, most are still classified as unemployed, which means that they are looking for work but have not yet found employment.
Unemployment • Unemployment • Total number of adults (aged 16 years or older) willing and able to work and who are actively looking for work but have not found a job • Unemployment creates a cost to the entire economy in terms of lost output – often ranging in the billions of dollars
Unemployment (cont'd) • Labor Force • Individuals aged 16 years or older who either have jobs or who are looking and available for jobs; the number of employed plus the number of unemployed • The unemployment rate is the percentage of the measured labor force that is unemployed
Figure 7-1 More Than a Century of Unemployment Source: U.S. Department of Labor, Bureau of Labor Statistics.
Figure 7-2 Adult Population Source: U.S. Department of Labor, Bureau of Labor Statistics.
Unemployment (cont'd) • Stock • The quantity of something, measured at a given point in time—for example, an inventory of goods • Flow • A quantity measured over time, such as the income you make per year, or the number of individuals fired every month
Unemployment (cont'd) • Categories of individuals without work • Job loser • Reentrant • Job leaver • New entrant
Unemployment (cont'd) • Job Loser • An individual whose employment was involuntarily terminated or who was laid off • 40–60% of the unemployed
Unemployment (cont'd) • Reentrant • An individual who has worked a full-time job before but left the labor force and has now reentered it looking for a job • 20–30% of the unemployed
Unemployment (cont'd) • Job Leaver • An individual who voluntarily quit • 10 to 15% of the unemployed
Unemployment (cont'd) • New Entrant • An individual who has never worked a full-time job for two weeks or longer • 10 to 15% of the unemployed
Unemployment (cont’d) • Duration of unemployment • More than a third of job seekers find work within one month • Approximately another third find employment within a second month • About a sixth are still unemployed after six months • Average duration varied between 10 and 20 weeks since the mid-1960s
Unemployment (cont'd) • Discouraged Workers • Individuals who have stopped looking for a job because they are convinced they will not find a suitable one • Question • How does the existence of discouraged workers bias the unemployment rate?
Unemployment (cont'd) • Labor Force Participation Rate • The proportion of non-institutionalized working-age individuals who are employed or seeking employment
The Major Types of Unemployment • The major types of unemployment • Frictional • Structural • Cyclical • Seasonal
Example: Fewer Men at Work – Or Even Looking for It • Since the beginning of 2008, the U.S. labor force participation rate has decreased by 2 full percentage points. • This translates into a departure of 5 million people from the labor force. • Men are heavily represented in this group of discouraged workers. • During the 2008 – 2009 recession, occupations dominated by male workers, such as construction and manufacturing, experienced the largest job losses.
The Major Types of Unemployment (cont'd) • Frictional Unemployment • Results from the fact that workers must search for appropriate job offers • This takes time, so they remain temporarily unemployed
The Major Types of Unemployment (cont'd) • Structural Unemployment • Unemployment of workers over lengthy intervals resulting from skill mismatches with position requirements of employers and from fewer jobs being offered by employers constrained by governmental business regulations and labor-market policies. • Considerable evidence shows that government labor market policies influence how many jobs businesses wish to create, thereby affecting structural unemployment.
Policy Example: Warning: WARN May Boost the Natural Unemployment Rate • In 1989, Congress passed the Worker Adjustment and Retraining Notification (WARN) Act. • The law requires firms to notify employees and provide benefits when 50 or more full-time workers are laid off. • The law rarely applied until the 2008–2009 recession, when many firms initiated large layoffs just to stay in business.
Policy Example: Warning: WARN May Boost the Natural Unemployment Rate • As the number of WARN-related court cases tripled, managers became more reluctant to hire new workers, wanting to avoid future layoffs. • As a consequence, the unemployment rate has remained high even as many companies are experiencing improved performance and profitability.
The Major Types of Unemployment (cont'd) • Cyclical Unemployment • Results from business recessions that occur when aggregate (total) demand is insufficient to create full employment
The Major Types of Unemployment (cont'd) • Seasonal Unemployment • Results from the seasonal pattern of work in specific industries • Due to seasonal fluctuations in demand or changing weather conditions that affect agriculture, construction, tourism industries and so on
Full Employment and the Natural Rate of Unemployment (cont'd) • Full Employment • An arbitrary level of unemployment that corresponds to “normal” friction in the labor market
Full Employment and the Natural Rate of Unemployment (cont'd) • Natural Rate of Unemployment • The unemployment rate that is estimated to prevail in the long-run macroeconomic equilibrium • Should not reflect cyclical unemployment • When seasonally adjusted, the natural rate should include only frictional and structural unemployment
Full Employment and the Natural Rate of Unemployment (cont'd) • Until the late 2000’s, most economists had considered the natural rate of unemployment to be about 5 percent. • Since the end of the 2008-2009 recession, however, the actual unemployment rate has been considerably in excess of 5 percent. • It has been suggested that higher structural unemployment arises from two sources: • The loss of jobs in construction, finance, and real estate • Government regulations that raise the costs of hiring new employees
Inflation and Deflation • Inflation • A sustained increase in the average of all prices of goods and services in an economy • Deflation • A sustained decrease in the average of all prices of goods and services in an economy
Inflation and Deflation (cont'd) • Purchasing Power • The value of money for buying goods and services • Varies with prices and income, e.g., if your money income stays the same but the price of one good goes up, your effective purchasing power falls
Inflation and Deflation (cont'd) • Nominal value • Price expressed in today’s dollars • Real value • Value expressed in purchasing power, adjusted for inflation
What If . . . City Governments Pass More Laws to Benefit All Employees? • Beginning in 2013, a new health care law went into effect that is expected to raise the cost of businesses providing health insurance coverage to their employees. • In addition, new laws are increasing the number of days that firms must allow employees to take off from work when they have a new child. • These regulations reduce the incentive for firms to hire new workers, thereby adding to structural unemployment.
Inflation and Deflation (cont'd) Measuring the Rate of Inflation • Market Basket • Representative bundle of goods and services • Base Year • The point of reference for comparison of prices in other years
Inflation and Deflation (cont'd) cost of market basket today cost of market basket in base year 100 Price index = • Price Index • The cost of today’s market basket of goods expressed as a percentage of the cost of the same market basket during a base year
Table 7-1 Calculating a Price Index for a Two-Good Market Basket
Inflation and Deflation (cont'd) • Real-world price indexes • Consumer Price Index (CPI) • Producer Price Index (PPI) • GDP deflator • Personal Consumption Expenditure (PCE)
Inflation and Deflation (cont'd) • Consumer Price Index (CPI) • A statistical measure of a weighted average of prices of a specified set of goods and services purchased by wage earners in urban areas • Market basket of goods and services of typical consumer
International Example: Why the Value of China’s Consumer Price Index Is Rising • In China, food accounts for about 35 percent of items in the consumer price index. • Food prices have been increasing so rapidly, however, that they account for most of the increase in China’s annual inflation rate.
Inflation and Deflation (cont'd) • Producer Price Index (PPI) • A statistical measure of a weighted average of prices of goods and services that firms produce and sell • Used as a short-run leading indicator (before CPI) • Producer Price Indexes for: • Foodstuffs • Intermediate goods • Finished goods
Inflation and Deflation (cont'd) • GDP Deflator • A price index measuring the changes in prices of all new goods and services produced in the economy • Broadest measure of prices; reflects both price changes and the public’s market responses to those price changes
Inflation and Deflation (cont'd) • Personal Consumption Expenditure (PCE) Index • A statistical measure of average price using annually updated weights based on consumer spending • Primary inflation indicator used by the Federal Reserve
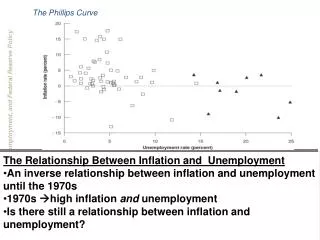
Figure 7-4 Inflation and Deflation in U.S. History Source: U.S. Department of Labor, Bureau of Labor Statistics.
International Policy Example: Argentina Penalizes Inflation Estimates That Are “Too High” • The official government measure of inflation reported in Argentina is typically lower than the inflation rate calculated by private firms. • The Argentine government has criticized the estimates of private firms and has imposed fines on inflation estimates that differ substantially from the inflation forecast. • Consequently, private firms that provide independent estimates do so only under the condition of confidentiality.
Anticipated versus Unanticipated Inflation • Anticipated versus unanticipated inflation • To determine who is hurt by inflation we distinguish between the two types • The effects of inflation on individuals depend upon which type of inflation exists
Anticipated versus Unanticipated Inflation (cont'd) • Anticipated Inflation • The inflation rate that we believe will occur • Unanticipated Inflation • Inflation at a rate that comes as a surprise
Anticipated versus Unanticipated Inflation (cont'd) • Inflation and interest rates • Nominal Rate of Interest • The market rate of interest expressed in today’s dollars • Real Rate of Interest • The nominal rate of interest minus the anticipated rate of inflation
Anticipated versus Unanticipated Inflation (cont'd) • Real interest rate • Nominal interest rate = 5% • Expected inflation rate = 3% • Real rate = 5% – 3% = 2%