Download

1 / 50
500 likes | 668 Vues
The Power of Promotional Products. Promotional Products Association International. Table Of Contents Section A: Industry Information and Statistics Section B: Applications of Promotional Products Section C: Research Studies Section D: Conclusion. SECTION A INDUSTRY INFORMATION AND STATISTICS.

E N D
The Power of Promotional Products Promotional Products Association International
Table Of ContentsSection A: Industry Information and StatisticsSection B: Applications of Promotional ProductsSection C: Research StudiesSection D: Conclusion
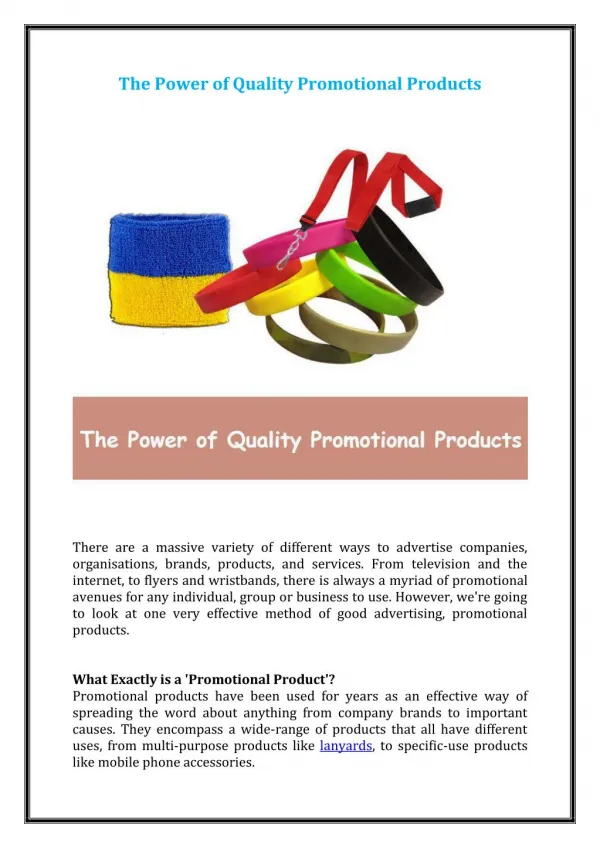
What are Promotional Products? Items used to promote a product, service or company program, including advertising specialties, premiums, incentives, business gifts, awards, prizes, commemoratives and other imprinted or decorated items.
How big is the Promotional Products Industry? . $18,013,763,752 Source: The PPAI 2005 Sales Volume Estimate
Growth of Industry Sales(PPAI Sales Volume Estimates by Year)
2005 SALES BY PRODUCT CATEGORY (2004 Figures in parentheses) Games 1.77% (2.72%) Stickers & Decals 2.02% (2.12%) Personal 1.58% (1.31%) Electronics 1.95% (1.71%) Food 1.74% (1.73%) Buttons/Badges/ Ribbons 2.12% (1.53%) Clocks & Watches 2.20% (2.16%) Automotive 2.27% (2.15%) Computers 2.28% (1.96%) Housewares 2.36% (2.30%) Wearables 29.16% (29.98%) Magnets 2.40% (1.84%) Sporting Goods 2.44% (2.34%) Textiles 2.60% (2.60%) Writing Instruments 10.39% (10.61%) Other 2.74% (3.76%) Recognition/Awards/Trophies/Jewelry 4.54% (4.32%) Calendars 7.20% (7.46%) Desk/Office/ Business Accessories 6.02% (5.69%) Drinkware 6.20% (6.25%) Bags 6.02% (5.46%) Source: 2005 PPAI Product and Program Category Surveys
Top Buyers of Promotional Productsby Industry • 1. Education • 2. Financial • 3. Healthcare • 4. Not for Profit • 5. Construction • 6. Government • 7. Trade, Professional Associations etc. • 8. Real Estate • 9. Automotive • 10. Professional: Doctors, Lawyers, CPA’s etc
SECTION B APPLICATIONS OF PROMOTIONAL PRODUCTS
2005 SALES BY PROGRAM CATEGORY (2004 in parentheses) Safety Education/Incentive 3.05% (3.39%) Marketing Research 1.18% (1.21%) Other 1.69% (1.13%) Customer Referral 3.15% (3.61%) Internal Promotions 4.31% (5.63%) Not-For-Profit Programs 4.69% (4.99%) Business Gifts 18.22% (17.84%) Employee Service Awards 5.45% (5.46%) Trade Shows 12.18% (12.14%) New Product/ Service Introduction 5.94% (5.78%) New Customer/Account Generation 7.25% (6.53%) Brand Awareness 9.29% (9.70%) Dealer/ Distributor Programs 7.60% (6.91%) Employee Relations & Events 8.39% (8.76%) Public Relations 7.62% (6.92%) Source: 2005 PPAI Product and Program Category Surveys
Advantages of Using Promotional Products • Flexible • Tangible and long-lasting • Impact easily measured • Higher perceived value • Complements targeted marketing • Complements other advertising media
Promotional Products’ Impact on Brand/ Company Image • An experimental study conducted by Georgia Southern University shows that recipients of promotional products have a significantly more positive image of a company than those who do not receive promotional products. • For the study, the researchers selected, as the test company, a restaurant located in a college town a few miles from a university campus. A 2005 Study by Georgia Southern University
Promotional Products’ Impact on Brand/ Company Image (contd.) • The group receiving the promotional product was significantly more likely to recommend the business to others than the group that received nothing.
Promotional Products’ Impact on Brand/ Company Image (contd.) • The group receiving the promotional product had a more positive image as evidenced in their comments about the company than the non-recipient control group. The difference was statistically significant.
Promotional Product Incentives Produce Valuable Referrals From Satisfied Customers • Accompanying a request for referrals, an offer of a promotional product incentive or an offer of a promotional product incentive and eligibility in a sweepstakes drew as many as 500 percent more referrals than an appeal letter alone. • Offers of promotional product incentives are likely to be substantially more effective than enclosing free promotional products with an appeal letter. A 2005 Study by Louisiana State University and Glenrich Business Studies
Effectiveness of Promotional Products at Tradeshows • 71.6% of attendees who received a promotional product remembered the name of the company that gave them the product • 76.3% of attendees had a favorable attitude toward the company that gave them the product A 2003 Study by Georgia Southern University
Increase Booth Traffic with Promotional Products Are Pre-show mailings with Promotional Product Offerings More Effective in Increasing Booth Traffic Than Mailings Without? • Including a promotional product with a pre-show mailing or an offer of a promotional product increases the likelihood of an attendee stopping by a tradeshow booth • As a general rule, promotional products of greater value generate more sales leads than products of lower value A 2004 study by Georgia Southern University
Reach: 71% of business travelers randomly surveyed at DFW Airport reported receiving a promotional product in the last 12 months 33.7% of this group had the item on their person - a coveted location for advertising Impact, Exposure and Influence of Promotional Products • Recall: • 76.1% of participants could recall the name of the advertiser on the promotional product that they received in the past 12 months • In comparison only 53.5% of participants could recall the name of an advertiser they had seen in a magazine or newspaper in the previous week. A 2004 Study by L.J Market Research
Impact, Exposure and Influence of Promotional Products (contd.) Impression of the Advertiser • 52% of participants in the study did business with the advertiser after receiving the promotional product. • Of those who had not done business with the advertiser that gave them the product, almost half stated that they were more likely to do business with the company that gave them the item • 52.1% of participants reported having a more favorable impression of the advertiser since receiving the item.
Impact, Exposure and Influence of Promotional Products (contd.) Frequency of Exposure/Lower Cost Per Impression • 73% of those who used the promotional product that they had received stated that they used it at least once a week • 45.2% used it at least once a day The greater the frequency of exposure, the lower the cost per Impression Repeated Exposure • 55% of participants generally kept their promotional products for more than a year. • 22% of participants kept the promotional product that they had received for at least six months.
Impact, Exposure and Influence of Promotional Products (contd.) Why Keep the Promotional Product • 75.4% of those who received a promotional product stated that they thought the item was useful • 20.2% kept the promotional product because they thought it was attractive Pass - Along Exposure • Participants of the study were asked what they do with promotional products that they do not keep. 26% of participants reported that they give the item to someone else.
Clients Respond to Business Gifts A study by Wayne State University demonstrated that business gifts not only improved sales but also customer attitudes. Results were compared among three groups: a) The letter Group -a group that received a letter of thanks b) The Silver Group - those that received a letter plus a silver desk set (a $20 value) c) The Gold Group - those that received a letter plus a gold desk set (A $40 value) A 1998 study by Wayne State University
Clients Respond to Business Gifts 1 = Very Dissatisfied/Very unlikely to buy and 7 = Very Satisfied/Very likely to buy
Trade Shows To promote traffic at its booth, an exhibitor sent invitations to 4900 trade show registrants. Registrants were further broken down into smaller groups, each of which received from zero to three gifts(before, at, and/or after the show). The researchers measured booth traffic, post-show memory of having received the invitation and goodwill toward the company. A 1991 Study by Exhibit Surveys, Inc
Trade ShowsBooth Visitation Rates 176% Increase
The use of promotional products in this study increased: • Booth visitation • Remembrance of the invitation • Feelings of goodwill
Improve Direct Mail Response Rates with Promotional Products • The use of promotional products in conjunction with a sales letter can make a significant difference in direct mail response rates. • The use of promotional products can also improve a business’ effectiveness in converting leads to sales appointments. A 1992 study by Silver Marketing Group
Findings * In terms of appointments secured
The inclusion of a Promotional Product to a mail promotion increased the response rate by 50%The use of Promotional Products as an incentive to respond generated four times as many responses as a sales letter aloneThe use of a Promotional Product as an incentive to respond reduced the cost per response by two- thirds.
Repeat Business New customers who receive promotional products, on average, return sooner and more frequently, and spend more money than new customers who receive coupons. In two separate studies, SMU researchers tested whether promotional products would outperform coupons in the area of repeat business and sales. Promotional product recipients spent 27% more than coupon recipients and 139% more than welcome letter recipients over an 8-month period. Promotional product recipients were also 49% more likely than coupon recipients and 75% more likely than letter recipients to return and patronize the business in each of the eight months studied. A 1994 Study by Southern Methodist University
Employee Awards and Incentives In 1994 Baylor University randomly surveyed 1,500 people, asking their opinions regarding employee awards and incentives. Survey recipients were asked to rate how most employees felt about awards and incentives. A 1994 Study by Baylor University
The survey found that: • Employees like awards and incentives • Employees are motivated to win awards • Employees work hard to win awards • Employees encourage their co-workers to work toward awards and incentives.
Motivating through Incentives • A 1999 survey by the Incentive Federation Inc., revealed that incentive programs are both highly effective as well as cost efficient. • The survey was sent to 4,000 executives in a cross section of American Companies. Respondents were current users of merchandise and travel items for motivation/incentive applications. • The study revealed that American businesses spend $23 billion annually on merchandise and travel for motivational use. A 1999 Incentive Federation Study
Percentage of Incentive Programs that Achieve Established Goals
Generate Customer Referrals Using Promotional Products A 1993 study by Baylor University found that customers who receive promotional products are more willing to provide leads than customers who don’t receive promotional products. Twenty Mary Kay consultants participated in a study where half of them distributed promotional gifts to customers and the other ten offered no promotional items to their customers. Both groups then asked customers (200 in all) to refer names of acquaintances. A 1993 Study by Baylor University
Customers who received a promotional product were 14% more likely to provide leads than those who did notSales people who gave promotional gifts to their customers received 22% more referrals than sales people who did not use promotional products40% of the salespeople who used gifts commented on how well the gifts were received by their customers
Build Customer Goodwill with Promotional Products • Promotional products foster customer goodwill toward a company and its salespeople. • A 1992 study by Baylor University, involved a textbook publisher sending 4000 educators either: 1) a pocket calculator plus a letter, 2) a lower priced highlighter pen plus a letter or 3) a letter only. A 1992 study by Baylor University
Feelings of Goodwill Toward Company and Sales Representative
The use of promotional products in this study resulted in: • An increase in feelings of goodwill toward the company and its salespeople • A more positive attitude among those who received the calculator than for those who received the less expensive highlighter pen • On questions relating to the customers’ personal feelings toward the company and its sales representatives, customers who received the calculator scored 52% higher than the letter only group.
Dimensional Mailings • The packaging of promotional products can evoke curiosity as well as an increase in direct mail response rates. A 1993 Baylor University study revealed that the use of dimensional mailers can significantly improve response rates over direct mail alone. • For this study 3000 school administrators were divided into three groups and received either: 1) sales letter and sales literature, 2) sales letter, literature and a promotional product, 3) the sales letter, sales literature and promotional product but delivered in a box with a die-cut slot. A 1993 Baylor University study
Improve Response Rates to an Advertising Campaign With Promotional Product Mailings In a 1996 study PPAI helped a national tile distributor integrate the use of direct mail and promotional products into a print advertising campaign. One group of subscribers received only the trade ad. Other groups received a sales letter, a promotional product, or a promotional product incentive along with the trade ad. 1996 study by Dallas Marketing Group
The value of Promotional Products is in their ability to carry a message to a well-defined audience. Because the products are useful to and appreciated by the recipients, they are retained and used, repeating the imprinted message many times without added cost to the advertiser.The information contained within this presentation will provide a greater knowledge of promotional products, the industry and its applications.
This information has been made available to you courtesy of Promotional Products Association InternationalFor more Information contact: PPAI, 3125 Skyway Circle North, Irving, Texas 75038 www.ppa.orgUPIC: PPAI