Download
1 / 61
630 likes | 1.11k Vues
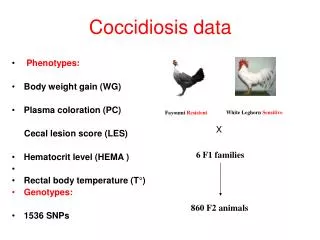
Immuno-epidemiology of coccidiosis. Don Klinkenberg Maite Severins Hans Heesterbeek. Coccidiosis. Caused by Eimeria spp Protozoan Intestinal infection sometimes lesions main problem: production loss Seven species in chickens location in the intestine no cross-immunity.

E N D
Immuno-epidemiology of coccidiosis Don Klinkenberg Maite Severins Hans Heesterbeek
Coccidiosis • Caused by Eimeria spp • Protozoan • Intestinal infection • sometimes lesions • main problem: production loss • Seven species in chickens • location in the intestine • no cross-immunity
Parasite classification • After lecture notes by Kretschmar (micro/macro):
Essential characteristics • Transmission through environment • Dose-dependent infectivity • Slowly acquired immune response • stronger upon re-infection • reduces parasite excretion • Within-host dynamics!
This presentation • Model of within-host dynamics • relation between uptake and excretion of infectious material (oocysts) • interaction with immune system • Model of between-host dynamics (I) • coupling excretion and uptake of oocysts • interaction chickens and environment • Model of between-host dynamics (II)
Within-host model • Eimeria characteristics: • transmission through oocysts • Eimeria parasitises gut epithelial cells • limited number of asexual generations
Oocyst uptake (W) Sporozoites Oocyst excretion (Z) Schizont I (X(1)) Gamont Merozoites I (u(1)) Merozoites II (u(2)) Schizont II (X(2)) Eimeria cycle
Oocyst uptake (W) Oocyst excretion (Z) Schizont I (X(1)) Schizont II (X(2)) Eimeria cycle
Oocyst uptake (W) Schizont I (X(1)) Schizont II (X(2)) Oocyst excretion (Z) Eimeria cycle
Adding immunity • Primarily T cell immunity • Immunity evoked by schizonts • Immunity inhibits schizont development • Keeping the model simple: one immunity variable Y
Oocyst uptake (W) Oocyst excretion (Z) Schizont I (X(1)) + Immunity (Y) – – + Schizont II (X(2)) Eimeria cycle with immunity
Eimeria cycle with immunity Oocyst uptake (W) Schizont I (X(1)) – + Schizont II (X(2)) Immunity (Y) + – Oocyst excretion (Z)
Eimeria cycle with immunity Oocyst uptake (W) Schizont I (X(1)) – + Schizont II (X(2)) Immunity (Y) + – Oocyst excretion (Z)
Model summary • Discrete time • Two asexual schizont generations • T cell immunity against schizont development
Model analysis • Compare model experiments to data • relation single dose and excretion • saturation followed by decrease • excretion during trickle infections • excretion terminates after some time • immunising effect of trickle and single immunisation • trickle immunisation gives better protection
Single dose and excretion E. tenella
Model analysis • Model experiments • single dose and excretion • relation between W0 and Z4 • trickle infections • trickle vs single immunisation
Analysis: single dose E. tenella
Analysis: single dose E. acervulina
Analysis: single dose E. maxima
Model analysis • Model experiments • single dose and excretion • relation between W0 and Z4 • b > 0 (naïve immunity growth) • m≠ 1 (non-linear immune effectiveness) • trickle infections & immunisation • conclusions on g and a
Conclusions within-host model • Simple model of parasite input-output behaviour • Single immunity variable can explain experimental data • Solid basis for studying re-infection and between-host transmission
Between-host model • Relate excretion to uptake with oocyst level in environment V • Simplifying assumption: average chicken
Oocyst uptake (W) Oocyst excretion (Z) Schizont I (X(1)) + Immunity (Y) – – + Schizont II (X(2)) Eimeria cycle
outside the chickens Environmental oocysts (V) × 1 × a0 Oocyst excretion (Z) Oocyst uptake (W) × 1 × a1 Immunity (Y) Gamont (G) + Schizont I (X(1)) + – – × l2 × l1 Schizont II (X(2)) inside the chickens Eimeria cycle
Two new parameters • Per time step of ca. 2 days • Uptake rate a0 • estimate from a single experiment: 0.01 • Oocyst degradation rate • estimate from couple of articles: 0.5
Interesting variables • Oocyst level in environment • decrease due to degradation (+ uptake) • increase due to excretion • Immunity level in average chicken • increase due to presence of schizonts • decrease by fixed rate • Number of infected cells as measure of damage • numbers of schizonts and gamonts
outside the chickens Environmental oocysts (V) × 1 × a0 Oocyst excretion (Z) Oocyst uptake (W) × 1 × a1 Immunity (Y) Gamont (G) + Schizont I (X(1)) + – – × l2 × l1 Schizont II (X(2)) inside the chickens 5 5 0 4 2 1 3 3 2
Dynamics in single chicken cohort • First dose of each infection generation most important • major change compared to previous dose • fast decay of oocysts in environment • Dynamics can be described in terms of infection generations
Damage in single chicken cohort • Cumulative damage ≈ maximum damage logdmax logv0
Conclusion on damage • Production damage is reflected by the maximum number of infected cells • Damage may take local minimum with intermediate oocyst level V0 • Mechanism • maximum damage if a single infection generation dominates • minimum when generation dominance switches
Damage in single chicken cohort • Cumulative damage ≈ maximum damage logdmax 1 3 2 4 schizonts II gamonts logv0
Discussion of the model • Single ‘average’ chicken • Deterministic model • No spatial effects
Different approach • Individual chickens • Stochastic model • Spatial model • Cost: • No continuous infection/immune level
Individual based model • Patches interact with walking chickens • Patches • oocyst level empty, low, medium, high (0; 103; 105; 107) • level rises if chicken excretes higher level • level falls after 14 days without excretion
Individual based model • Chickens • walk or ‘shuffle’ each hour • pick up maximum daily exposure (0, 101; 3; 5) • excrete once per day depending on • uptake -4 days • level of immunity (no, partial, full) • regulated by excretion templates • immunity level may increase depending on • time since first dose • number and level of doses