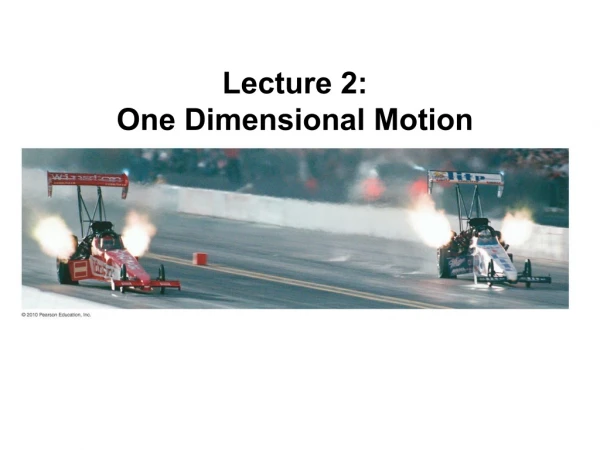
Lecture 2: One Dimensional Motion
330 likes | 490 Vues
Lecture 2: One Dimensional Motion. “ position ” is obviously a vector. Example: when looking at a 2-dimensional map “ 2 miles South ”. Scalars and Vectors. Note: this implicitly has 2 numbers in it: “ 0 miles East ”. Scalar – a numerical value. May be positive or negative.

Lecture 2: One Dimensional Motion
E N D
Presentation Transcript
Lecture 2: One Dimensional Motion
“position” is obviously a vector. Example: when looking at a 2-dimensional map “2 miles South” Scalars and Vectors Note: this implicitly has 2 numbers in it: “0 miles East” • Scalar – a numerical value. May be positive or negative. • Examples: temperature, speed, height • Vector – a quantity with both magnitude and direction. • Examples: displacement (e.g., 10 feet north), force, magnetic field “position”corresponds to“displacement”, a vector. length of travel is“distance”, a scaler
Position, Distance, and Displacement Before describing motion, you must set up a coordinate system – define an origin and a positive direction. The distance is the total length of travel; if you drive from your house to the grocery store and back, you have covered a distance of 8.6 mi. Your net displacement is zero.
Position, Distance, and Displacement If you drive from your house to the grocery store and then to your friend’s house, your displacement is -2.1 mi and the distance you have traveled is 10.7 mi.
Walking the Dog You and your dog go for a walk to the park. On the way, your dog takes many side trips to chase squirrels or examine fire hydrants. When you arrive at the park, do you and your dog have the same displacement? a) yes b) no
Follow-up: have you and your dog traveled the same distance? Walking the Dog You and your dog go for a walk to the park. On the way, your dog takes many side trips to chase squirrels or examine fire hydrants. When you arrive at the park, do you and your dog have the same displacement? a) yes b) no Yes, you have the same displacement. Because you and your dog had the same initial position and the same final position, then you have (by definition) the same displacement.
10.7 miles sav = 0.5 hours = 21.4 miles/hr Average Speed The average speed is defined as the distance traveled divided by the time the trip took: Average speed = distance / elapsed time If you drive from your house to the grocery store and then to your friend’s house, your displacement is -2.1 mi and the distance you have traveled is 10.7 mi. The trip takes 30 minutes (with traffic and lights). What is your average speed?
Average Velocity Average velocity = displacement / elapsed time If you return to your starting point, your average velocity is zero.
Walking the Dog II You and your dog go for a walk to the park. On the way, your dog takes many side trips to chase squirrels or examine fire hydrants. When you arrive at the park, you affectionately pat your dog’s head. Which statement correctly describes your average speed and velocity relative to that of your dog, on the trip from home to the park? a) Average speed and average velocity were both different b) Average speed was the same, but average velocity was different c) Average speed was different, but average velocity was the same d) Average speed and average velocity were the same
Walking the Dog II You and your dog go for a walk to the park. On the way, your dog takes many side trips to chase squirrels or examine fire hydrants. When you arrive at the park, you affectionately pat your dog’s head. Which statement correctly describes your average speed and velocity relative to that of your dog, on the trip from home to the park? a) Average speed and average velocity were both different b) Average speed was the same, but average velocity was different c) Average speed was different, but average velocity was the same d) Average speed and average velocity were the same Your dog’s many side trips mean that he travelled more distance than you in the same amount of time, so his average speed must have been greater. However, his net displacement was the same (starting and ending at the same place), so his average velocity must have been the same.
Averaging Speed Is the average speed of the red car a) 40.0 mi/h, b) more than 40.0 mi/h, or c) less than 40.0 mi/h? Hint: is t1 = t2?
average velocity Position vs. Time Consider this motion sequence, plotted here in one-dimension... ...and here as an x-t graph
Instantaneous Velocity Evaluating the average velocity over a shorter and shorter period of time, one approaches the “instantaneous velocity”. The instantaneous velocity is tangent to the curve.
Graphical Interpretation of Average and Instantaneous Velocity
x t Position v. Time I a) it speeds up all the time b) it slows down all the time c) it moves at constant velocity d) sometimes it speeds up and sometimes it slows down e) not really sure The graph of position versus time for a car is given below. What can you say about the velocity of the car over time?
x Position v. Time I t a) it speeds up all the time b) it slows down all the time c) it moves at constant velocity d) sometimes it speeds up and sometimes it slows down e) not really sure The graph of position versus time for a car is given below. What can you say about the velocity of the car over time? The car moves at a constant velocity because the x vs. t plot shows astraight line.The slope of a straight line isconstant. Remember that theslopeof x vs. t is the velocity!
x t Position v. Time II The graph of position vs. time for a car is given below. What can you say about the velocity of the car over time? a) it speeds up all the time b) it slows down all the time c) it moves at constant velocity d) sometimes it speeds up and sometimes it slows down e) not really sure
t Position v. Time II The graph of position vs. time for a car is given below. What can you say about the velocity of the car over time? a) it speeds up all the time b) it slows down all the time c) it moves at constant velocity d) sometimes it speeds up and sometimes it slows down e) not really sure The car slows down all the time because the slope of the x vs. t graph is diminishing as time goes on. Remember that the slope of x vs. t is the velocity! At large t, the value of the position x does not change, indicating that the car must be at rest. x
Acceleration Average acceleration: Instantaneous acceleration:
Graphical Interpretation of Average and Instantaneous Acceleration
Sign of Acceleration Does deceleration mean “negative acceleration”? No. It means “decreasing speed”. Speed Decreasing
Acceleration Acceleration (increasing speed) and deceleration (decreasing speed) should not be confused with the direction (or sign) of velocity and acceleration:
Graphical Interpretation of Average and Instantaneous Acceleration
Constant Acceleration If the acceleration is constant, the velocity changes linearly with time: Average velocity:
v v v v b: a: c: d: t t t t Propeller car e: Not Sure Which of the above plots represents the v vs. t graph for the motion of the propeller car after it was pushed?
v v v v b: a: c: d: t t t t Propeller car e: Not Sure The car has a negative initial velocity, but a constant positive acceleration. So the plot should start at a negative value, and increase linearly with increasing time. Which of the above plots represents the v vs. t graph for the motion of the propeller car after it was pushed?
Motion with Constant Acceleration Position as a function of time
Motion with Constant Acceleration The relationship between position and time follows a characteristic curve. My guess: a ~ 7 m/s2
x Propeller car displacement Which of the displayed plots represents the x vs. t graph for the motion of the propeller car after it was pushed? t
x Propeller car displacement Which of the displayed plots represents the x vs. t graph for the motion of the propeller car after it was pushed? t The car starts at zero position, with a negative initial velocity, so the displacement is growing in the negative direction. The slope is changing linearly with time to become more positive. It should be a smooth change, go through a minimum, and then change more and more quickly with increasing timex = v0t + 1/2 at2
Motion with Constant Acceleration Velocity as a function of position
Stopping Distance deaccelerating with constant a, take final velocity = 0, find (x-x0) = “stopping distance” 1/2 Stopping Distance v = 0.7 v0 3/4 Stopping Distance Tip for save driving: if you double your speed, what happens to your stopping distance?
Clickers, everyday, in class. • Assignment 1 on MasteringPhysics. Due Tuesday, September 2, at midnight! • Reading, for next class Chapter 2.6-2.7, 3.1-3.6 • When you exit, please use the REAR doors!