Download
1 / 45
470 likes | 670 Vues
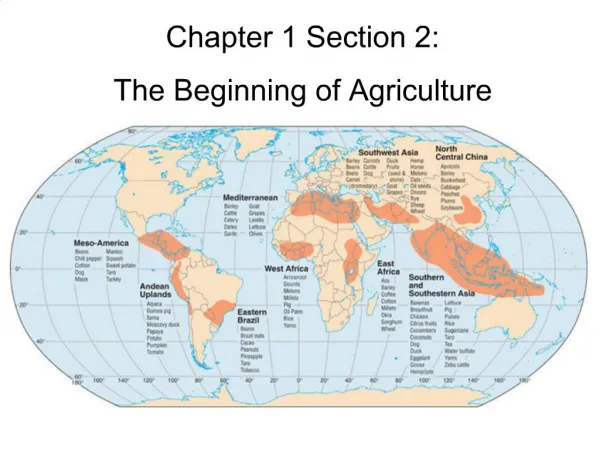
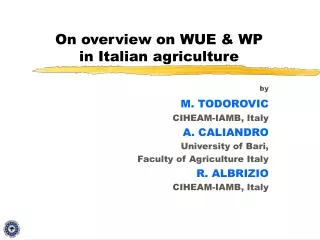
On overview on WUE & WP in Italian agriculture. by M. TODOROVIC CIHEAM-IAMB, Italy A. CALIANDRO University of Bari, Faculty of Agriculture Italy R. ALBRIZIO CIHEAM-IAMB, Italy. Main climatic zones according to the Köppen climatic classification. Bari.

E N D
On overview on WUE & WPin Italian agriculture by M. TODOROVIC CIHEAM-IAMB, Italy A. CALIANDRO University of Bari, Faculty of Agriculture Italy R. ALBRIZIO CIHEAM-IAMB, Italy
Main climatic zonesaccording to the Köppen climatic classification Bari Source: www.italocorotondo.it/tequila/partner_section/italy_english/
TemperatureMinimum and Maximum Bari Bari Source: UCEA, Rome, 1995)
Sunshine hours and precipitation Bari Bari Source: UCEA, Rome, 1995)
Waterresourcesavailability synthesis * there are some difference between data coming from different sources Source: ANPA, 2001; IRSA CNR, 1999; EUOSTAT, 1998; AQUASTAT, 1998, Blue Plan, 2001
Regional distribution of potentially usable water resources in Italy In m3/person/year … In percentage … Source: IRSA CNR, 1999
Sectorial water use in Italy fora hydrologically normal (1991) and a dry (1999) year * Includes only the use of freshwater for thermoelectric plant cooling Source: ISTAT, 1991; IRSA CNR, 1999; MPAF 2004
Land use in Italy and EU countries + + - + (*) Greece, Spain, Portugal. (**) France, Germany, Belgium, Luxemburg, Denmark, The Netherlands, (***) Excluding UK and Ireland, (1) Including temporary forage crops and set aside. (2) Tree and other permanent crops (woods and forests). (3) Including glaciers and eternal snow. (4) Man-made and industrial settlements, infrastructure, rocks and barren land; ornamental parks and gardens, roads, railways, etc. Source: INEA, 2003, on EUROSTAT survey
Irrigable and irrigated land Source: ISTAT, 2002
Irrigated crops in Italy in ha and as % of total cultivated area of each crop 113,600 ha 217,000 ha 622,000 ha 189,000 ha 81,000 ha 183,000 ha 267,000 ha Source: ISTAT, 2002
Irrigation methods in Italy 202,000 ha 2,300 ha 75,318 ha 1,047,000 ha 290,700 ha surface and furrow 850,480 ha Source: ISTAT, 2002
Group for Irrigation StudiesGruppo di Studio sull’irrigazione - GRU.S.I. • Constituted in 1962-63 and promoted by the Italian National Research Council • Main research themes: • Crop yield response to irrigation water • Crop water requirements • Biomass and Yield WUE (WP) • Water saving practices, deficit irrigation etc. Biomass & Yield (E)Tc
Studies on Crop yield response to irrigation water
Trend of some herbaceous crops production Based on data from Policoro, Southern Italy Source: Venezian Scarascia et al., 1987
Mitscherlich model modified by Giardini and Borin • y = crop production • ym = max obtainable crop production under non-limited water supply • c = coefficient of increase, indicating the rapidity of achievement of the maximum production • k = coefficient of depression, indicating the tendency of y to decrease after achievement of the maximum value • b = quantity of water available for the crop in natural conditions • d = quantity of water applied under specific experimental conditions
Parameters of the Mitscherich equation,flex point coordinatesandseasonal irrigation volumes at 100% of yield Based on data from Policoro, Southern Italy
Production of some herbaceous crops as a function of seasonal water volumes expressed as % of estimated ETc with the indication ofthe flex pointsof different curves Based on data from Policoro, Southern Italy Source: Venezian Scarascia et al., 1987
Seasonal irrigation volumes for some herbaceous crops corresponding to the 70% of maximum yield Based on data from Policoro, Southern Italy Source: Venezian Scarascia et al., 1987
Seasonal irrigation volumes of some herbaceous crops in relation to the adopted irrigation regime Spring sugarbeet Irrigation volume (m3/ha) Pepper Autumnal sugarbeet Eggplant Summer maize Spring maize Dry bean Processing tomato Shell bean ETc (%)
Studies on Crop Water Requirements
Type, dimensions and number of lysimetersused at various Italian locations
Variation of crop coefficient Kc’ (ETc/E)of tomato grown in two Italian locations Lat. 45°12’N Long. 11°58’E Alt. 6 m a.s.l. Lat. 40°12’N Long. 16°40’E Alt. 15 m a.s.l. E: emergence; F1: start of flowering; F2: full flowering; H: harvesting Source: Tarantino and Caliandro, 1984
Variation of crop coefficient Kc’ (ETc/E)of spring sugarbeet grown in various Italian locations Lat. 44°35’N Long. 11°27’E Alt. 33 m a.s.l. Lat. 40°12’N Long. 16°40’E Alt. 15 m a.s.l. Source: Caliandro et al., 1980
Variation of crop coefficient Kc’ (ETc/E)of maize grown in various Italian environments 43°43’N 44°22’N 44°25’N 45°12’N 41°27’N 40°12’N Source: various
Variation of crop coefficient Kc’ (ETc/E)of sorghum grown in various Italian environments Lat. 44°25’N Long. 10°57’E Alt. 490 m a.s.l. Lat. 40°12’N Long. 16°40’E Alt. 15 m a.s.l. Source: Caliandro et al., 1980
Variation of crop coefficient Kc’ (ETc/E)of sunflower grown in various Italian environments 44°25’ 490 m a.s.l. 41°27’ 72 m a.s.l. 44° 22’ 30 m a.s.l. Source: various
Variation of crop coefficient Kc’ (ETc/E)of soya grown in various Italian environments Source: ISTAT, 2002
Average Kc’ values of various herbaceous cropsin respect to the class “A” evaporation Source: various
Relation between estimated and measured by lysimeter crop coefficients (Kc) during muskmelon cycle cultivated with (a) and without mulch (b) in 2001 and 2003 – Lavello (Southern Italy) Source: Lovelli et al., 2002
Kc (ETc/ETo) values of muskmeloncultivated under mulches and without mulchesPolicoro (Southern Italy) Source: Cantore et al., 2005
Kc (ETc/ETo) values of eggplant cultivated under mulches and without mulches – Policoro (Southern Italy) Source: Yared Tesfagaber , 2004
WUE & WP Data
Above-ground Biomass WUE and Yield WUE of field-grown crops under optimal conditions in Southern Italy
Above-ground Biomass WUE and Yield WUE of field-grown crops submitted to different irrigation regimes *avg of 2 years
Above-ground Biomass WUE and Yield WUE of field-grown crops submitted to application of fertilizers
Above-ground Biomass WUE and Yield WUE of field-grown crops submitted to other agronomic practices (mulching and early sowing)
Studies on Deficit Irrigation
Deficit irrigation of peach tree • phase 1 – from the start of flowering to the formation of small fruits (of 3-4 cm of diameter); • phase 2 – from the end of the previous phase until the hardening of the kernel; • phase 3 – from the hardening of the kernel until the harvesting; • phase 4 – from the harvesting until the fall of the leaves. Source: Mannini, 2004
Deficit irrigation% of seasonal irrigation volumes saved by controlled water stress on peach in respect to normal irrigation regime • Data refer to the Emilia-Romagna climatic conditions • Similar results have been obtained in the experiments on peach and nectarine trees under Southern Italy climatic conditions Source: Mannini, 2004
Variation of maize production under different irrigation treatments • s = irrigation only at sowing • b = irrigation only at bout phase • s+b = irrigation at sowing and bout phase
Instead of conclusion • A huge amount of data on WUE & WP related issues is available in Italy • More efforts should be done to make data comparable due to the application of different methods to determine “water used” and due to the use of different nominators/denominators in WUE and WP ratios. • A more clear conceptualization of WUE and WP terms is necessary at regional scale. • Standardization of procedures and normalization of ETc for evaporative demand of the atmosphere is needed in order to compare the experiments carried out in different years/locations. • Improvement of the crop management practices in the region should aim at increase of beneficial water consumption (transpiration) against the non-beneficial losses (evaporation), i.e. on WUE & WP • Increasing of marketable yield per unit of water transpired • Maximizing transpiration consumption relative to evaporation losses • Enhancing effective use of rainfall and water stored in soil
Irrigation methods in Italy Source: ISTAT, 2002