Download
1 / 8
80 likes | 212 Vues
Clustering of MS/MS spectra for glycan biomarker discovery. Anoop Mayampurath , Chuan- Yih Yu. Motivation. Currently, glycomic profiles only use MS data, which give us only the general view of glycan chain in terms of abundance.

E N D
Clustering of MS/MS spectra for glycan biomarker discovery AnoopMayampurath, Chuan-Yih Yu
Motivation • Currently, glycomic profiles only use MS data, which give us only the general view of glycan chain in terms of abundance.
Analysis of MALDI-TOF Mass Spectrometry Data for Discovery ofPeptide and Glycan Biomarkers of Hepatocellular Carcinoma • This paper introduces computational methods for quantitative comparison of peptides and glycans in serum for biomarker discovery using MS data only. HCC: Hepatocellular Carcinoma ( Cancer of liver) CLD: Chronic liver disease J. Proteome Res., 2008, 7 (2), pp 603–610 Publication Date (Web): January 12, 2008 (Article) DOI: 10.1021/pr0705237
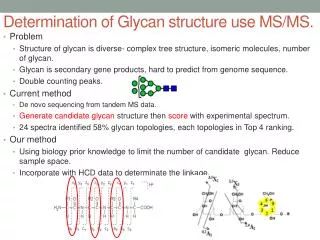
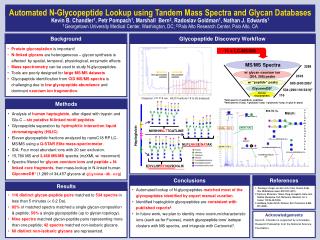
High Energy CID • TOF/TOF has high-energy dissociation that causes cross-ring dissociation. • Data will contain X, and A series ions. • We will be able gather glycan linkage information from this data.
Our goal • We want to enhance this method by extending the analysis to tandem MS data which give us structural glycan information. • The goal is find out whether the linkage of glycans will be the causes of disease or not. • Furthermore, we world like to build a reliable protocol incorporate this kind of data.
Concept Remove the least significant component. Repeat until all the score above threshold. Health spectra (H1, H2, H3…Hk) Pair-wise correlation Disease spectra (D1, D2, D3…Dk) Find the differences of two spectra
Dataset • We contacted to the author to ask for the data set. • If we don’t have it in time, we will create our simulated date.