Download
1 / 25
250 likes | 361 Vues
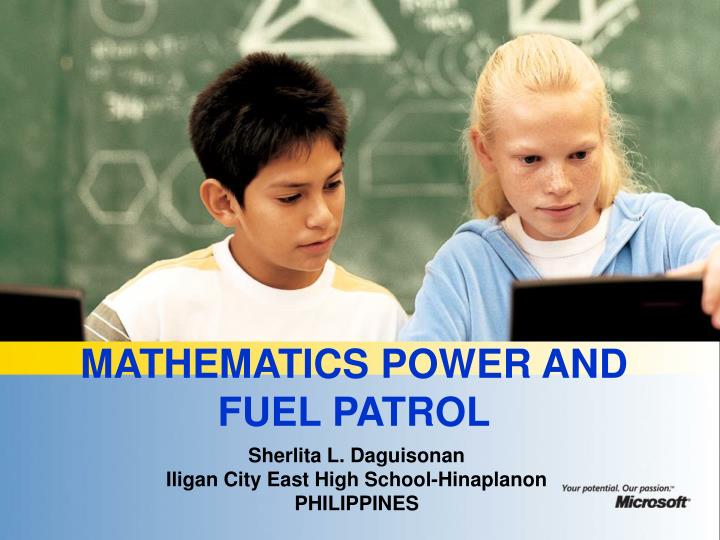
MATHEMATICS POWER AND FUEL PATROL. Sherlita L. Daguisonan Iligan City East High School-Hinaplanon PHILIPPINES. CONTEXT. School Population: 1,326 students. Number of Computers: 23 computers. Class size: 61 students. Learning Competencies:.

E N D
MATHEMATICS POWER AND FUEL PATROL Sherlita L. Daguisonan Iligan City East High School-Hinaplanon PHILIPPINES
CONTEXT School Population: 1,326 students Number of Computers: 23 computers Class size: 61 students
Learning Competencies: • At the end of this activity a 1st Year student in Math • Reads an electric meter and fuel gauge of a motor vehicle; • Records and tabulates data and observation; • Analyzes and computes data gathered; • Expresses relationship between two quantities using • ratio; • Uses the concept of proportion and percent in solving • two quantities; • Gives situations illustrating problems that involve • percentage; • Synthesizes concepts in ratio, proportion and percent • using spreadsheets; and • Expresses concepts learned using PowerPoint Presentation.
Learning Activity A. Procedure: • Students were asked to monitor their • electricity and fuel consumption using • a power patrol report card and journal in • fuel consumption. Parents of students were • required to sign the card and the journal. • Power Patrol is given as an individual project • while journal in fuel consumption is given • as a group project.
Power Patrol Report Card (Sample)
Journal in Fuel Consumption (Sample)
Procedure • Data gathered in the Power Patrol • Report Card and Journal in Fuel • Consumption served as the basis in • discussing the concepts of ratio, • proportion and percent. The result of • the discussion provided a good • springboard for the integration of • computer technology.
Procedure • To expound and give meaningful analysis • on the data, the students were asked to • graph/chart the result using the MS Excel • Program and MS PowerPoint Presentation • on Household Tips in Saving Energy.
1. Preparation of equipment/instrument/materials. 2. Arrangement of computer time schedule 3. Identification of teaching skills. 4. Identification of student prerequisite skills. 5. Meeting with parents as participant to the learning process. 6. Critiquing of assessment tools by the math faculty. B. Implementation Strategies
By the teacher * Designing of technology enhanced lesson/unit plan. * Integration to the present curricular program of the Department of Education. * Presentation of the Lesson using the MS PowerPoint. By the student • They used technology to synthesize concepts in ratio, • proportion and percent using MS Excel Program • and expressed concepts learned using MS PowerPoint • Presentation. How the technology was used:
MS PowerPoint Presentation Group 1 Group 4 Students Outputs MS EXCEL
Teacher Reflection • The use of technology has given the • teacher a wider perspective regarding the teaching profession. It has made her more effective by regarding the learner as the center of the educative process.
In the Multimedia session, these were some of the students’ comments: “Gwapoha ani uy? Nindot man kaayo. Pwede pa butangan ug sounds ug effects” (Wow! very beautiful. This is very good. We can also give sounds and effects!) “Dali ra ta katuon ani kay naa man picture. Pwede pa gyud ta mokuha ug pictures sa Encarta. Mao ni among gipangita ma’am. Malingaw mi ani.” (It’s very easy for us to learn here because of the pictures/illustrations. We can even get pictures from Encarta. This is what we are looking for. Learning becomes entertaining.)
In the MS EXCEL session, students’ comments were: “Grabe wala may pila ka minutes graph man dayon!”.(Fantastic! In a split of a second, the graph is done.) “ Mao ni gwapo. Pwede pa coloran daritso” (This is good. We can even color our graph at once) “Dili na mahalin graphing paper ani!” ( No one would dare to buy an ordinary graphing paper now )
CONCLUSION • * Mathematics can be taught using computer • technology as a tool that attracts students • participation and moves them toward • greater learning. • * The students indicated that using technology • helped them understand concepts on ratio, proportion and percent. They also understood the complexity of math as a subject.
CONCLUSION • Learning was enhanced.. • Critical thinking was developed. • Math concepts became more relevant to • their lives.
MABUHAY Philippines