Download
1 / 8
80 likes | 97 Vues
This study investigates the influence of H3K4me2 and H3K4me3 on gene expression in CD4 T cells, revealing dynamic changes in key pathways. Analyses include plots of peak distributions, principal coordinates, and gene expression levels over time. Significant differences are observed in RNA expression patterns associated with varying H3K4me2:H3K4me3 ratios and time points.

E N D
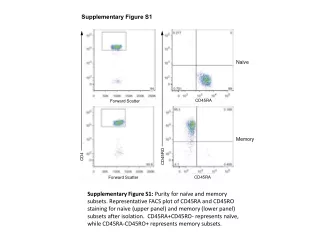
Supplementary Figure S1: Purity for naïve and memory subsets. Representative FACS plot of CD45RA and CD45RO staining for naïve (upper panel) and memory (lower panel) subsets after isolation. CD45RA+CD45RO- represents naïve, while CD45RA-CD45RO+ represents memory subsets.
Supplementary Figure S2: Plot of the average distance from the transcriptional start site (TSS) to the summit of H3K4me2 and H3K4me3 promoter peaks reveals the majority of called peaks fall within 1 kb of the TSS for both modifications.
Supplementary Figure S3: Plots of the distributions of coverage depths across every position in the genome for each sample. The x-axis represents coverage normalized for sequencing depth, so perfect replicates should coincide regardless of variations in sequencing depth.
Supplementary Figure S4: Plots of the first 4 principal coordinates for H3K4me2 (a,b) and H3K4me3 (c,d) data. In addition to the samples themselves, the mean of each treatment group has been marked with a crosshair, and group means for each cell type have been connected in time point order to show the trajectory of each cell type over time.
Supplementary Figure S5: Maximum number of peaks called at an IDR threshold of 2% between any pair of donors in each condition. These numbers were used as the numbers of consensus peaks for each condition.
Supplementary Figure S6: MA plots of each H3K4me2 ChIP-Seq sample log2(CPM) against the mean log2fold change of all other samples generated with an anti-H3K4me2 antibody after TMM normalization.
Supplementary Figure S7: MA plots of each H3K4me3 ChIP-Seq sample log2(CPM) against the mean log2fold change of all other samples generated with an anti-H3K4me3 antibody after TMM normalization.
Supplementary Figure S8: Promoter H3K4me2 and H3K4me3 are dynamic and impact expression of key pathways in CD4 T cells. A) The percentage of genes increasing or decreasing 1 day after activation is plotted for different ratios of H3K4me2:H3K4me3 in resting naïve cells. Chi-square analysis demonstrates significant differences between these gene subsets (p<1x10⁻⁵). B) Genes with H3K4me3 alone demonstrate low RNA expression. Mean resting RNA expression in naïve CD4 T cells for genes with increasing ratios of H3K4me2:H3K4me3 are plotted. Error bars represent standard error of the mean. Reported p-values are from Tukey’s HSD post-hoc analysis following one-way ANOVA. C) Distribution of RNA expression for genes in all conditions containing H3K4me2 peaks alone, H3K4me3 peaks alone, H3K4me2 and H3K4me3 peaks, or no H3K4me. Mann-Whitney p-values for each comparison are displayed in Supplementary Table S7. D) RNA expression for all time points examined was plotted for genes decreasing in H3K4me2 alone, H3K4me3 alone, and both at 5 days. Error bars represent standard error of the mean. ****p<1x10⁻⁵, *p<0.01from Fisher’s LSD post-hoc analysis following one-way ANOVA. E) RNA-Seq data at 1 day for three genes enriched for H3K4me3 in memory CD4 T cells at rest display striking increases by 1 day compared to naïve. P-values represent quasi-likelihood F-test. F) Genes increasing in H3K4me3 by 5 days in naïve cells heavily populate networks pertaining to cellular maintenance and hematologic system development/differentiation centered around NFκB. Shaded symbols represent genes increasing in promoter H3K4me3 at 5 days. Dotted arrows represent indirect interactions between genes, while solid arrows represent direct interactions.