UFOs in the LHC
650 likes | 818 Vues
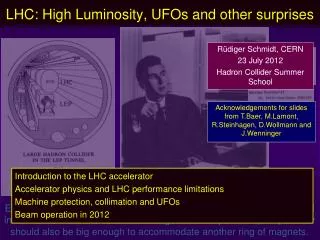
UFOs in the LHC. CERN MAC #4 Tobias Baer August, 12 th 2011.

UFOs in the LHC
E N D
Presentation Transcript
UFOs in the LHC • CERN MAC #4 Tobias Baer August, 12th 2011 Acknowledgements: G. Arduini, W. Bartmann, M. Barnes, C. Bracco, M. Ferro-Luzzi, N. Garrel, B. Goddard, E.B. Holzer, S. Jackson, M. Jimenez, V. Mertens, M. Misiowiec,E. Nebot, L. Norderhaug Drosdal, A. Nordt, J. Uythoven, B. Velghe, J. Wenninger, C. Zamantzas, F. Zimmermann, …
UFOs in the LHC • Since July 2010, 35 fast loss events led to a beam dump. • 18 in 2010, 17 in 2011. 13 around MKIs. 6 dumps by experiments. 1 at 450 GeV. • Typical characteristics: • Loss duration: about 10 turns • Oftenunconventionallosslocations (e.g. in thearc) • The events are believed to be due to (Unidentified) Falling Objects (UFOs). Spatialand temporal lossprofileof UFO on 23.08.2010
UFOs Below Dump Threshold • 2010: Logged BLM data was analyzed and 113 sub-threshold UFO events were found.(E. Nebot) • For 2011: Online UFO detection in 1Hz BLM data. • Over 10000 candidate UFOsbelow threshold found. • Most events are much below threshold. • Between 2010 and 2011,UFO related beam dumpswere reduced by increasingthe BLM thresholds for losseson ms scale by a factor 5. 2780 arc UFOs (≥cell 12) at 3.5 TeVwith signal RS05 > 2∙10-4Gy/s. Distribution ofarc UFOs.
Spatial UFO Distribution 3.5 TeV3686 candidate UFOs. Signal RS05 > 2∙10-4Gy/s. Red:Signal RS01 > 1∙10-2Gy/s. 450 GeV486 candidate UFOs. • Signal RS05 > 2∙10-4Gy/s. Mainly UFOs around MKIs UFOs occur all aroundthemachine. ManyUFOs aroundinjectionkickermagnets (MKIs). gray areas around IRs are excluded from UFO detection.
UFO rate • On average6.0 UFOs/hour. • Nointensitydependencyforabove a fewhundredbunches. 5238 candidate UFOs in cell 12 or larger during stable beams. Fills with at least 1 hour stable beams are considered.
Intrafill UFO rate • The UFO rate stays constant during a fill. 3375 candidate arc UFOs (cell 12) during stable beams in 31 fills with at least 10 hours stable beams.
Energy Dependency • Ufo amplitude:At 7 TeVabout3 timeshigherthanat 3.5TeV.(from wire scans).(E. Nebot, IPAC 2011) • BLM thresholds: Arc thresholds at7 TeV are about a factor 5 smallerthan at 3.5 TeV. • UFO rate: Noenergydependencywouldbecompetativewithobservations. (E. Nebot, IPAC 2011) • From 2011 data: 82 UFO beam dumpsbyarc UFOs for 7 TeV(comparedto 2 actualdumpsat 3.5 TeV). E. Nebot Wirescanduringramp
UFOs and Dust Particle Distribution • The measured distribution of dust particles in SM12/Bat113 would explain the UFO distribution. 3670 arc UFOs (>cell 12) at 3.5 TeVwith signal RS01 > 1∙10-3Gy/s. courtesy of J. M. Jimenez
Dynamics of Dust Particles • From simulations: • Dust particle will be positively ionized and be repelled from the beam. • Loss duration of a few ms. • Losses become faster for larger beam intensities. 2.3∙1012 protonsround Al Object 4.6∙1013 protons3.5 TeV courtesy of F. Zimmermann
Loss Duration • UFOs have the tendency to become faster with increasing intensity. (cf. E.B. Holzer at Evian Dec. 2010) courtesy ofE. Nebot
MKI UFOs • 13 beam dumps due to UFOs around the injection kicker magnets (MKIs)10 dumps at MKI.D5L2 • In total ≈1500 UFOs around MKIs 614 in Pt.2 and 874 in Pt.8 • Most events within 30min after the last injection. 479 candidate UFOs around injection regions for fills lasting at least 3 hours after last injection.
Layout of MKI Region MKI.D MKI.C MKI.B MKI.A
UFOs at MKIs • In Pt.2 most MKI UFOs startatthe BLM after MKI.D5L2. • In Pt.8 less UFOs start at the MKI.A5R8. Beam direction Beam direction 174 candidate UFOs around MKI in Pt.2. Signal RS01 > 1∙10-3Gy/s. 270 candidate UFOs around MKI in Pt.8. Signal RS01 > 1∙10-3Gy/s. Right of IP8 Left of IP2
MKI UFO MD • 21 pulses of MKIs, 43 UFO type loss pattern observed. • In 17 cases: UFO type loss pattern within the second of MKI pulse. • In 2 cases: UFO recorded by BLM injection capture buffer. TDI 4R8 beam MKI D 5R8 UFO Kicker pulse Spatial loss pattern Temporal loss pattern
UFO Dynamics • From fit tolosses (MKI-D): • Amplitude: 1.8·10-2Gy/s (Threshold: 11.6 Gy/s) • Temporal Width: 160 µs • Time delay to kicker pulse: 7.6 ms • resulting acceleration (constant particle acceleration): 658 m/s² • resulting speed during interaction with beam: 5.0 m/s • UFO type loss signal observed after many normal injections. 7.6ms
Next Steps • MKI UFO MD (28.08.). • Study MKI/MKQA UFOs with improved diagnostics and better statistics. • Study dust particle dynamics. • Improve diagnostics (during next TS). • Dedicated turn-by-turn BLM Study Buffer. • Improved BLM data logging. • FLUKA simulations on MKI UFOs. • Open MKI and search for dust particles. • Dust particle dynamics model. • Better understanding of Quench Limit. • Mitigation: Further increase of BLM thresholds...But: Do we have enough margin at higher energies?
Summary andConclusion • 17 beam dumps due to UFOs in 2011 so far (18 in 2010). • Over 10000 candidate UFOs below threshold detected. On average 6.0 UFOs/hour during stable beams in the arcs. Micrometer sized macroparticlesare the most plausible explanation. • Many UFOs around injection kicker magnets.Many MKI UFOs observed directly after kicker pulsing/injection. • Observations show an aggressive scaling with beam energy! Situation could be significantly worse above 3.5TeV. Intermediate energy step would be very helpful for extrapolations to nominal energy. • Large effort underway to understand UFO mechanism.Measurements in LHC, lab measurements, simulations, theories.
Thank you • for your Attention • Tobias Baer • CERN BE/OP • Tobias.Baer@cern.ch • Office: +41 22 76 75379 • Further information: • T. Baer, “UFO update”, Mini-Chamonix Workshop, July 2011. • R. Ballester, “Vibration analysis on an LHC kicker prototype for UFOs investigation”, EDMS Report No. 1153686, August 2011. • M. Sapinski, “Is the BLM system ready to go to higher intensities?”, Workshop on LHC Performance, Chamonix, Jan. 2011. • F. Zimmermann, “Interaction of macro-particles with the LHC proton beam”, IPAC’10.
Beam dump on 29.05.2011 • Dump on running sum 1-6.
Beam dump 29.05.2011 • From fit to losses (BLMQI.28L8.B1E10_MQ): • Amplitude: 2.4 Gy/s (Threshold: 2.1 Gy/s) • Temporal Width: 97 µs resulting speed of transiting dust particle = 3.6 m/s.(assuming ϵn=2.5µm·rad) (also cf. J. Wenninger at MPP March 2011)
Event Rate 2010 • 113 events below threshold found in 2010. (E. Nebot) • UFO rate: proportional tobeam intensity. courtesy ofE. Nebot
UFOs Detection in 2011 • 2010: 113 UFOs below threshold found in logging database. (E. Nebot) • 2011: Online UFO detection from live BLM data.Losses (RS 4) of two BLMs in 40m are above 1E-4 Gy/s.RS 2 / RS 1 > 0.55 (UFO average : 0.89). RS 3 / RS 2 > 0.45 (UFO average: 0.79). • Over 10000 triggers so far. • From subset of about 300 manually verified triggers: About 65% are UFOs, 15% ambiguous cases, 20% are false triggers. • For most analysis additional cut. E.g.: Only flat top UFOs, loss of UFO BLM (RS05) > 2∙10-4Gy/s (≈ 2 ‰ of threshold). 74 events remain of subset, of which 71 are clear UFOs (96%) and 3 are ambiguous cases.
Weighted Spatial UFO Distribution • The weighted spatial distribution isdominated by a few large amplitude UFOs. MKIs 5875 candidate UFOs at 3.5 TeV. Gray areas around IRs are excluded from UFO detection. around WS/BSRT 28L8
Normalized UFO rate 2194 candidate UFOs during stable beams in fills with at least 1 hour stable beams.Signal RS05 > 2∙10-4Gy/s. Data scaled with 1.76 (detection efficiency from reference data)
Peak Signal courtesy ofE. Nebot • No clear dependency of peak loss on intensity. (cf. E.B. Holzer at Evian Dec. 2010) • No clear dependency of peak loss on bunch intensity.
UFO rate vsBunchIntensity • Nodependencyof UFO rate on buch intensity.
Peak Signal vs Loss Duration • Tendency that harder UFOs are faster. courtesy ofE. Nebot
Loss Duration • Tloss: Given by fitting single function (Gaussian up to t=Tloss, 1/t afterwards) to data. • ) courtesy ofE. Nebot
Calibration of Tloss • Correlation of Tloss and width of Gaussian fitted topost mortem turn-by-turn data. courtesy ofE. Nebot
UFO size • Two extreme cases: • UFO much larger than beam: the beam is imaging the UFO. • UFO much smaller than beam: the UFO is imaging the beam. Most UFO shapes are Gaussian, thus most UFOs are expected to be smaller than the beam. • From FLUKA simulations: size ≈ 1 μm. (cf. M. Sapinski, F. Zimmermann at Chamonix 2011) courtesy ofJ. Wenninger(cf. MPP 25.03.2011)
UFO Speed • UFO speed: • From free fall: • The UFO speed corresponds to the expected speed for a free fall from the aperture. εnorm = 2.5 µm·rad β = 150 m 22 mm free fall vu: UFO speed, σb: transverse beam size, σu: UFO size,σT: temporal width of loss.
Beam dump on 6.6.2011 • UFO at MKI in Pt. 2, at 450 GeV. • Small loss signal at Q5 (backscattering?). TCT MKIs
Beam dump 06.06.2011 • From fit to losses (BLMEI.05L2.B1E10_MKI.D5L2.B1): • Amplitude: 7.73 Gy/s (Threshold: 2.3 Gy/s) • Width: 0.77 ms resulting speed of transiting dust particle = 0.47 m/s.(assuming ϵn=2.2µm·rad) (Brennan Goddard)
MKI UFOs DuringScrubbing • Typical scenario for MKI UFOs during scrubbing: The MKI UFO rate is increased for about 10 minutes after each injection. 2 hours
Number of MKI UFOs • On average: 9.4 MKI UFOs per fill (5.4 at MKI.L2 and 3.9 at MKI.R8). 1042 candidate UFOs around injection regions in Pt. 2 and Pt.8 for fills reaching stable beams with >200 bunches. MKI UFO storms in Pt. 2 After MKI flashover
Number of Large MKI UFOs B1 • The large number of strong MKI UFOs in Pt. 2 disappeared in the fills after the technical stop. MKI Beam 1 160 candidate UFOs around injection regions in Pt. 2 for fills reaching stable beams with >200 bunches.Signal RS01 > 1∙10-2Gy/s.
MKI UFO Storms • Fill 1898 (26th June): 15 UFOs MKI B1, 7 UFOs MKI B2. • 14 UFOs at MKI B1 within 40 min. • Highest UFO: 34% of Threshold at TCTH.4L2 (RS1, RS2) at 3.5 TeV. • Fill 1900 (27th June): 32 UFOs MKI B1, 5 UFOs MKI B2. • 17 UFOs at MKI B1 within 6 min. • Highest UFO: 65% of Threshold at MQY.04L2 (RS6) at 3.5 TeV. • Fill 1901 (28th June): 41 UFOs MKI B1, 12 UFOs MKI B2. • 16 UFOs at MKI B1 in 2:20 min. • Mostly at 450 GeV (12 min. at 450 GeV after last injection). • Highest UFO: 63% of Threshold at TCTH.4L2 (RS8) at 450 GeV.
Number of large MKI UFOs B2 • The number of large MKI UFOs in Pt. 8 did not increase. MKI Beam 2 70 candidate UFOs around injection regions in Pt. 8 for fills reaching stable beams. Signal RS01 > 1∙10-2Gy/s.
Vacuum Valve Movement • Closure of vacuum valves. orange: Several valves closed, blue: VVGST.193.5L2 and VVGST.3.5L2 closed, green: status unknown for several valves. VVGST.101.5L2.B VVGST.101.5L2.R VVGST.136.5L2.B VVGST.136.5L2.R VVGST.140.5L2.B VVGST.140.5L2.R VVGST.175.5L2.B VVGST.175.5L2.R VVGST.193.5L2.B VVGST.21.5L2.B VVGST.21.5L2.R VVGST.3.5L2.B VVGST.56.5L2.B VVGST.56.5L2.R VVGST.61.5L2.B VVGST.61.5L2.R VVGST.96.5L2.B VVGST.96.5L2.R VVGST.101.5L2.B VVGST.101.5L2.R VVGST.136.5L2.B VVGST.136.5L2.R VVGST.140.5L2.B VVGST.140.5L2.R VVGST.175.5L2.B VVGST.175.5L2.R VVGST.193.5L2.B VVGST.21.5L2.B VVGST.21.5L2.R VVGST.3.5L2.B VVGST.56.5L2.B VVGST.56.5L2.R VVGST.61.5L2.B VVGST.61.5L2.R VVGST.96.5L2.B VVGST.96.5L2.R MKI Beam 1 152 candidate UFOs around injection regions in Pt. 2 for fills reaching stable beams. Signal RS01 > 1∙10-2Gy/s. VVGST.101.5L2.B VVGST.101.5L2.R VVGST.140.5L2.B VVGST.140.5L2.R VVGST.175.5L2.B VVGST.175.5L2.R VVGST.193.5L2.B VVGST.21.5L2.B VVGST.21.5L2.R VVGST.3.5L2.B VVGST.56.5L2.B VVGST.56.5L2.R VVGST.61.5L2.B VVGST.61.5L2.R VVGST.96.5L2.B VVGST.96.5L2.R VVGST.101.5L2.B VVGST.101.5L2.R VVGST.136.5L2.B VVGST.136.5L2.R VVGST.140.5L2.R VVGST.175.5L2.B VVGST.175.5L2.R
UFO Location • Sometimes BLMs upstream of the BLM with the highest have only slighly smaller losses. • Analyzing first BLM above minsignal (as defined in plot) First BLM to see UFO UFO BLM minsignal = 75% of difference in log scale. BLMQI.05R8.B1I10_MQY
UFOs at MKIs • 08.04. – 05.05. in total 460fast loss events around MKIs. (104 around MKI in IP2, 336 around MKI in IP8). • Distribution of first BLM which sees the loss: Beam direction Beam direction Right of IP8 Left of IP2