1 / 5

*p<0.05, TAC+veh vs TAC+CI

NM / veh. NM / CI. veh. Myo / veh. Myo / CI. CI. (A). (B). *. Apoptosis (%). *. LV EF (%). sham. 1wk. 3wk. Time after TAC. Time after TAC. *p<0.05, TAC+veh vs TAC+CI. Suppl. Figure 1. (B). (A). 40µm. WGA + DAPI. 40µm. CC3 + WGA + DAPI. Suppl. Figure 2. 40 m.

boris
Télécharger la présentation

*p<0.05, TAC+veh vs TAC+CI

An Image/Link below is provided (as is) to download presentation Download Policy: Content on the Website is provided to you AS IS for your information and personal use and may not be sold / licensed / shared on other websites without getting consent from its author. Content is provided to you AS IS for your information and personal use only. Download presentation by click this link. While downloading, if for some reason you are not able to download a presentation, the publisher may have deleted the file from their server. During download, if you can't get a presentation, the file might be deleted by the publisher.

E N D

Presentation Transcript


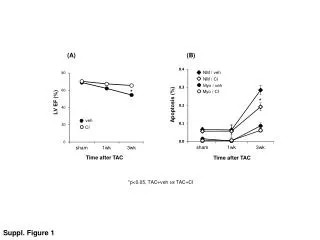
  1. NM / veh NM / CI veh Myo / veh Myo / CI CI (A) (B) * Apoptosis (%) * LV EF (%) sham 1wk 3wk Time after TAC Time after TAC *p<0.05, TAC+veh vs TAC+CI Suppl. Figure 1

  2. (B) (A) 40µm WGA + DAPI 40µm CC3+ WGA + DAPI Suppl. Figure 2

  3. 40m CI + 3wk TAC sham veh + 3wk TAC Suppl. Figure 3

  4. veh + TAC CI + TAC (A) PSR 200µm (B) Masson’s trichrome 100µm (C) CTGF 100µm Suppl. Figure 4 CTGF+ WGA

  5. (B) (A) veh CI PE PE Suppl. Figure 5

More Related