Download
1 / 25
250 likes | 399 Vues
Simulation of efficiency and time resolution of Resistive Plate Chambers at high rate. Presented by Marcello Abbrescia University and INFN - Bari - Italy. CBM meeting Darmstadt. GSI, Germany March 10th, 2005. The problem.

E N D
Simulation of efficiency and time resolution of Resistive Plate Chambers at high rate Presented by Marcello Abbrescia University and INFN - Bari - Italy CBM meeting Darmstadt GSI, Germany March 10th, 2005
The problem Resistive Plate Chamber are wide spread gaseous detectors, introduced in the 1970s. RPCs were at first used in streamer mode, for cosmic rays applications, then in avalanche mode, to increase rate capability Their physics has been understood, partially, much later; in particular almost no theoretical prediction could be made until two years ago about their behaviour at high rate … i.e. the LHC, or other important cases The goal of this study was to write a comprehensive model which could help to explain the observed features, predict its behaviour and help in detector design GSI-2005 Darmstadt, March 10th, 2005 Marcello Abbrescia - University of Bari
xsat Exponential growth Saturation “Drift” Exponential growth Drift The story up to now Many quantities in the formula above are themselves stochasticvariables. The induced charge is the “convolution” of all these variables. A Monte Carlo rather elaborated GSI-2005 Darmstadt, March 10th, 2005 Marcello Abbrescia - University of Bari
When saturation does not play Charge Spectra shape: these are the most fundamental information you can get Freon rich mixture Gap: 9 mm Comparison between Monte-Carlo predictions and experimental data Gap: 2 mm Argon rich mixture : primary cluster density (from 3 to 5 cl/mm) : 1st Townsend “effective” coefficient GSI-2005 Darmstadt, March 10th, 2005 Marcello Abbrescia - University of Bari
...and when saturation becomes important Simulation This is not a fit! Experiment HV=9.2 kV Gas mixture: C2H2F4/C4H10 97/3 + SF6 2% Input for simulation: Colucci et al., NIM A 425 (1999) 84-91 Experimental data from Camarri et al., NIM A 414 (1998) 317-324 GSI-2005 Darmstadt, March 10th, 2005 Marcello Abbrescia - University of Bari
Simulation Experiment HV=9.4 kV ...and when saturation becomes important This is not a fit! Gas mixture: C2H2F4/C4H10 97/3 + SF6 2% Input for simulation: Colucci et al., NIM A 425 (1999) 84-91 Experimental data from Camarri et al., NIM A 414 (1998) 317-324 GSI-2005 Darmstadt, March 10th, 2005 Marcello Abbrescia - University of Bari
Simulation Experiment HV=9.5 kV ...and when saturation becomes important This is not a fit! Inefficiency peak Saturation broad peak Gas mixture: C2H2F4/C4H10 97/3 + SF6 2% Input for simulation: Colucci et al., NIM A 425 (1999) 84-91 Experimental data from Camarri et al., NIM A 414 (1998) 317-324 GSI-2005 Darmstadt, March 10th, 2005 Marcello Abbrescia - University of Bari
Simulation Experiment HV=9.7 kV ...and when saturation becomes important This is not a fit! Saturation broad peak Inefficiency peak Gas mixture: C2H2F4/C4H10 97/3 + SF6 2% Input for simulation: Colucci et al., NIM A 425 (1999) 84-91 Experimental data from Camarri et al., NIM A 414 (1998) 317-324 GSI-2005 Darmstadt, March 10th, 2005 Marcello Abbrescia - University of Bari
Simulation Experiment HV=9.9 kV ...and when saturation becomes important This is not a fit! Saturation broad peak Inefficiency peak Gas mixture: C2H2F4/C4H10 97/3 + SF6 2% Input for simulation: Colucci et al., NIM A 425 (1999) 84-91 Experimental data from Camarri et al., NIM A 414 (1998) 317-324 GSI-2005 Darmstadt, March 10th, 2005 Marcello Abbrescia - University of Bari
Simulation Experiment HV=10.1 kV ...and when saturation becomes important This is not a fit! Saturation broad peak Inefficiency peak Gas mixture: C2H2F4/C4H10 97/3 + SF6 2% Input for simulation: Colucci et al., NIM A 425 (1999) 84-91 Experimental data from Camarri et al., NIM A 414 (1998) 317-324 GSI-2005 Darmstadt, March 10th, 2005 Marcello Abbrescia - University of Bari
Cg Cb Rb The “single cell” model None of the simulations up to now take into account the role of the bakelite resistivity ...we could be simulating metal or insulating electrodes Recovery time independent of the cell dimension ... typical avalanche radius: 100 m typical avalanche charge: 1 pC typical external charge contained in 100 m: 10 pC A few numbers: GSI-2005 Darmstadt, March 10th, 2005 Marcello Abbrescia - University of Bari
High HV “at start” Big pulses What happens in the “single cell” =20 Hz Applied HV =1500 ms Area of the cell = 1 mm2 There is a sort of feedback ... 5 1011cm GSI-2005 Darmstadt, March 10th, 2005 Marcello Abbrescia - University of Bari
Effective HV vs. rate Applied HV 10 Hz The effective HV diminishes and its distribution is broader. 13 Hz 20 Hz (...until HVeff is too low) • Two consequences: • lower HV at high rate • greater HV variations at high rate GSI-2005 Darmstadt, March 10th, 2005 Marcello Abbrescia - University of Bari
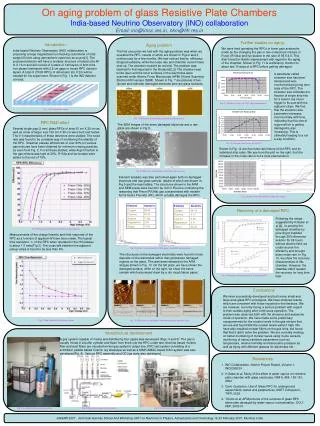
Efficiency vs. rate Experiment 4 1010 cm Simulation 8 1010 cm From C. Bacci et al., NIM A 352(1995) 552-556 Cut-off rate of the experimental efficiency well simulated: slightly higher value of resistivity needed (significant?) GSI-2005 Darmstadt, March 10th, 2005 Marcello Abbrescia - University of Bari
Rate capability dependances 8 1010 cm 1011 cm HV=10100 V 4 1011 cm HV=9800 V HV=9600 V 6 1011 cm HV=9200 V 4 1011 cm HV=10100 V independent of applied voltage Cut-off rate True in the “single cell” model only strongly dependent on resistivity GSI-2005 Darmstadt, March 10th, 2005 Marcello Abbrescia - University of Bari
Rate capability in streamer mode 8 1010 cm Streamer charge distribution has been simulated also by “artificially” multiplying by 10 both avalanche charge, and area on the electrodes. Cut off rate reproduced also in the streamer case. Simulation streamer Exp. avalanche Efficiency rate dependance different. Exp. streamer From R. Arnaldi et al., NIM A 456(2000) 73-76 GSI-2005 Darmstadt, March 10th, 2005 Marcello Abbrescia - University of Bari
Efficiency vs. HV and rate Very good agreement ~ 2 Hz/cm2 At high rate the shape of the simulated efficiency curve seem to change and differ from the experimental one. ~ 1.5 kHz/cm2 Experimental Simulation Data from G. Aielli et al., NIM A 478(2002) 271-276 GSI-2005 Darmstadt, March 10th, 2005 Marcello Abbrescia - University of Bari
Time resolution What is the origin of signal time fluctuations in an RPC? There are very good analytic studies (Mangiarotti et al.), here just a few hints will be given from a MC point of view. They are not related to the particle transit time in the gas gap • Total number of clusters • Total number of electrons in each cluster • Fluctuations superimposed on the exponential growth All the cluster in the gap contribute at the same manner to the signal GSI-2005 Darmstadt, March 10th, 2005 Marcello Abbrescia - University of Bari
Reasons for time fluctuations Total number of electrons Avalanche growth fluctuations Other types of fluctuations • local charge density • surface charging and discharging • In a real RPC: • signal delay time along the strip • deformation during propagation • electronics … not directly related to the gap width GSI-2005 Darmstadt, March 10th, 2005 Marcello Abbrescia - University of Bari
Some (obvious) results Time delay decreases with a HV increase ... Time resolution becomes better with a HV increase A double gap has a better resolution with respect to a single gap GSI-2005 Darmstadt, March 10th, 2005 Marcello Abbrescia - University of Bari
1. Systematics on drift velocity 2. “Instrumental” effects not reproduced Possible Reasons Time resolution vs. rate Data from C. Bacci et al., NIM A 352(1995) 552-556 Simulated Experimental 0.2 kHz/cm2 =0.9 ns 1 kHz/cm2 =1.2 ns 4 kHz/cm2 =1.6 ns General behaviour well reproduced ... Simulated time resolutions slightly less than experimental. GSI-2005 Darmstadt, March 10th, 2005 Marcello Abbrescia - University of Bari
Time delay and resolution vs. rate Time Delay Time resolution 4 ns 3.8 ns Experimental (arbitary zero) Experimental Simulation (absolute scale) Simulation The absolute scale of the simulation refers to the passage of the ionising particle. GSI-2005 Darmstadt, March 10th, 2005 Marcello Abbrescia - University of Bari
avalanche “small” “large” Cg Rs,b Cb Rb The future 1/2: The multi cell model The area of the inefficiency cell increases as the bakelite surface resistivity decreases. The net results is that the current flows not only in the “central” cell, but also in the neighbouring ones. “Surface” coupling resistors GSI-2005 Darmstadt, March 10th, 2005 Marcello Abbrescia - University of Bari
The future 2/2: The model has been mainly applied to predict the behaviour of “trigger” RPCs,i.e. tipically 2-3 mm gas gap, high efficiency and good (~ 1 ns) time resolution. It would be interesting to use it in the most recent and interesting application, i.e. T.O.F. RPCs, where very good time resolution (better than 100 ps) is required. • The problems in this case: • probably very strong saturation effects take place • (to account for the observed efficiency) • The gas parameters are even less known that in the trigger RPCs case, due to the higher electric field It would be interesting to compare with analytical models (Fonte, Mangiarotti, Gobbi, et al.), for a cross-check GSI-2005 Darmstadt, March 10th, 2005 Marcello Abbrescia - University of Bari
Conclusions It is the first time the role of resistivityis taken into account in simulation of ResistivePlate Chambers ... The model of the dry water becomes wet. Even the single cell model reproduces well the efficiency and time resolution vs. rate. The role of resistivity and collected charge seems to be clear. Charge spectra are well understood. • Slight differences remain, both for the “static” and the “dynamic” case ... could be due to • uncertainty in gas (and other) parameters. • possible refinements of the model. GSI-2005 Darmstadt, March 10th, 2005 Marcello Abbrescia - University of Bari