Download
1 / 8
80 likes | 177 Vues
Explore the significant percentage changes in academic performance from 2011 to 2012 in Reading, Math, Writing, and Science, comparing MSP scores and school-wide averages. Dive deep into cohort comparisons for 4th to 5th grade and 5th to 6th grade classes.

E N D
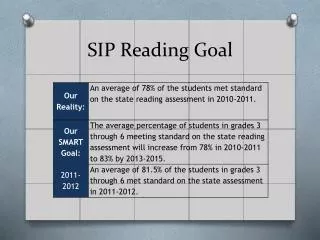
MSP Comparison 2011 to 2012 Reading Percentages 2010-2011 2011-2012 85.5 3rd 85.7 .2 83.6 4th 72.6 11.0 65.5 5th 85.0 19.5 76.4 6th 82.7 6.3 77.7 Average 81.5 3.8%
MSP Comparison 2011 to 2012 Math Percentages 2010-2011 2011-2012 72.1 3rd 80.4 8.3 62.3 4th 80.6 18.3 65.5 5th 75.0 9.5 68.5 6th 63.5 5.0 67.1 Average 74.97.8%
MSP Comparison 2011 to 2012 Writing Percentages 2010-2011 2011-2012 72.1 4th 79.0 6.9% Science Percentages 2010-2011 2011-2012 56.9 5th 76.7 19.8%
MSP Comparison 2011 to 2012 MSP School wide Overall 2010-2011 2011-2012 708.4 781.12 10.3%
MSP Cohort Comparison 11 to 12 Last year’s 4th Grade – this year’s 5th Grade Class of 2020 2010-2011 2011-2012 85.5 Reading 72.6 12.9% 72.1 Math 80.6 8.5%
MSP Cohort Comparison 11 to 12 Last year’s 5th Grade – this year’s 6th grade Class of 2019 2010-2011 2011-2012 83.6 Reading 85.0 1.4% 62.3 Math 75.0 12.7%