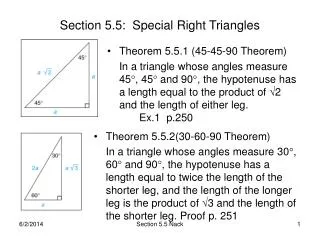
Section 5.5
Section 5.5. Poisson Probability Distributions. Poisson Probability Distribution. What is it?. Requirements:.

Section 5.5
E N D
Presentation Transcript
Section 5.5 Poisson Probability Distributions
Poisson Probability Distribution What is it? Requirements: • A poisson probability distribution is a special kind of probability distribution that applies to occurrences of some event over a specified interval. The Poisson distribution is often used for describing rare events (small probabilities). • The random variable x is the number of occurrences of an event over some interval. • The occurrences must be random. • The occurrences must be independent of each other. • The occurrences must be uniformly distributed over the interval being used.
Examples of Poisson Distributions • Patients arriving at an emergency room. • Radioactive decay. • Crashes on a highway. • Internet users logging onto a website.
A formula for Calculating Probability The Formula The Components • P(x): The probability of an event occurring x times over an interval. • e: The number “e” where e = 2.71828. • x: The number of occurrences of the event in an interval. • mu: The mean.
Differences Between Binomial and Poisson • The binomial distribution is affected by the sample size n and the probability p, whereas the Poisson distribution is affected only by the mean, mu. • In a binomial distribution, the possible values of the random variable x are 0, 1, …, n, but a Poisson distribution has possible x values of 0, 1, …, with no upper limit.
A Lucky Die • An experiment involves rolling a die 6 times and counting the number of 2’s that occur. If we calculate the probability of x = 0 occurrences of 2 using the Poisson distribution we get 0.368, but we get 0.335 if we use the binomial distribution. Which is the correct probability of getting no 2’s when a die is rolled 6 times? Why is the other probability wrong?
Mean and Standard Deviation of the Poisson Probability Distribution Formulas Remember: • Mean is the same as expected value • This is what you would expect the average to be after an infinite number of trials • Standard deviation represents the spread of the data that you would expect to see • The mean is • The standard deviation is
Poisson Rule of Thumb • The Poisson distribution can also be used to approximate the binomial distribution when using the binomial distribution would result in a tedious calculation. However, certain requirements must be met in order to do this. Not all problems can use a Poisson distribution. • Requirements for Using the Poisson Distribution as an Approximation to the Binomial • n ≥ 100 • np≤ 10 In this situation, we need a value for mu. That value can be calculated by using the formula present in section 5.4
Example • In the Illinois Pick 3 game, you pay $0.50 to select a sequence of three digits, such as 729. If you play this game once every day, find the probability of winning exactly once in 365 days.
Example Dutchess County, New York, has been experiencing a mean of 35.4 motor vehicle deaths each year. • Find the mean number of deaths per day. • Find the probability that on a given day, there are more than 2 motor vehicle deaths. • Is it unusual to have more than 2?
Other Options TI-83+ and TI-84 Direction Your Toolbox • Press 2nd VARS (to get DISTR), then select the option identified as poissonpdf • Complete the entry of poissonpdf( , x) then press ENTER. • Use a TI-83/84 Plus. • Use the formulas • BOOM DONE!
Example Dutchess County, New York, has been experiencing a mean of 35.4 motor vehicle deaths each year. • Find the mean number of deaths per day. • Find the probability that on a given day, there are more than 2 motor vehicle deaths. • Is it unusual to have more than 2?
Example • Radioactive atoms are unstable because they have too much energy. When they release their extra energy, they are said to decay. When studying cesium-137, a nuclear engineer found that over 365 days, 1,000,000 radioactive atoms decayed to 977,287 radioactive atoms. • Find the mean number of radioactive atoms that decayed in a day. • Find the probability that on a given day, 50 radioactive atoms decayed.
Homework • Pg. 238-239 #10, 12, 15 (use Binomial and Poisson distributions for #15)