Download
1 / 15
150 likes | 328 Vues
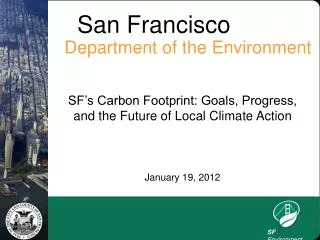
Homicide and Serious Gun Violence in San Francisco. Berkeley Center for Criminal Justice BerkeleyLaw UNIVERSITY OF CALIFORNIA. November 2008. Homicide and Serious Gun Violence in San Francisco. Anthony A. Braga David Onek Sarah Lawrence.

E N D
Homicide and Serious Gun Violence in San Francisco Berkeley Center for Criminal Justice BerkeleyLawUNIVERSITY OF CALIFORNIA November 2008
Homicide and Serious Gun Violence in San Francisco Anthony A. Braga David Onek Sarah Lawrence November 2008
Characteristics of San Francisco Homicide Victims 2007, N= 98 • 73.5% were victims of gun shot wounds • 86.7% were males • 88.8% were non-white • Black – 54.1% • Hispanic – 24.5% • White – 11.2% • Asian – 7.1% • Other – 3.1% • 33.7% were ages 24 and under • Mean age = 31.5 years old
Criminal Histories of San Francisco Homicide Offenders and Victims in 2007 38 arrested offenders 98 victims 71.1% previously known to CJ System 76.5% previously known to CJ system Of these 27 “known” offenders… Of these 75 “known” victims… Mean of 11.8 prior arrests Mean of 12.9 prior arrests 70.4% at least one violent crime 70.7% at least one violent crime 63.0% at least one drug crime 68.0% at least one drug crime 66.7% at least one property crime 65.3% at least one property crime 70.4% at least one disorder offense 69.3% at least one disorder offense 44.4% at least one non-violent gun crime 26.7% at least one non-violent gun crime
Circumstances of SF Homicides2004 – 2006 (N = 268)2007 (N = 98) N % N % Gang – related131 48.8% 46 46.9% Gang – ongoing groups 75 28.0% 24 24.5% Gang – personal beef 31 11.6% 12 12.2% Gang – drug 16 6.0% 8 8.2% Gang – internal 9 3.4% 2 2.0% Personal dispute 45 16.8% 21 21.4% Ongoing dispute 23 8.6% 11 11.2% Sudden argument 22 8.2% 10 10.2% Drug – related 24 9.0% 13 13.2% Dispute involving drug business 16 6.0% 12 12.2% Drug robbery 8 3.0% 1 1.0% Robbery 19 7.1% 4 4.1% Domestic / Family Violence 16 6.0% 8 8.2% Unknown / Other 33 12.3% 6 6.1%
CONFLICTS AMONG ACTIVE SAN FRANCISCO STREET GANGS Key: Alliance = Conflict = NORTENOS SURENOS 550 Natoma VSE Cambodian Crips MS 20th Street 11th Street 19th Street 16th Street Front Street Back Street 22B LNS SFM Shotyblock 21 ABL 24th & Hampshire 24 YSM La Salle 31st Street E - Mob NSL 30th Street Kirkwood / BNT G-Island Big Block 26 BC Uptown Western Addition Downtown Western Addition Army Street Eddy Rock Death Valley Posse Oakdale West Mob Double Rock Knock Out Posse Choppa City / Turkwood Central Divis Players 800 Block Down the Hill Towerside Mac Block / Swiss Cheese Goldmine Westside Up the Hill Thomas Paine Alemany Page Street No Active Conflicts Tenderloin Boys Pinoy Boys Quesada JSP / C-Town Diamond Heights Internal Conflicts Zooside / Missouri 25th Street 200-400 Randolph Parkside June 2008
Serious Violence is Highly Concentrated in San Francisco • 53 identified gangs • Estimated 1,497 to 1,954 key members • Represent less than 1% of 198,011 SF residents between 15 and 34 years of age (US Census 2005 estimate) • Represent less than 3% of 64,680 SF residents between 15 and 24 years of age • Generated 47% of 98 homicides in 2007 • Gang turf covers 2.4% of SF’s 47 sq. mi. • 34.1% of 375 shootings occur in gang turf areas in 2007 • Hot spot areas cluster in and around gang turf areas • Hot spots cover 2.1% of SF’s 47 sq. mi. • 42.1% of 375 shootings occur in hot spot areas in 2007