Download
1 / 26
300 likes | 704 Vues
Chapter 6 Thermal oxidation and the Si/SiO 2 interface. SiO 2 properties and applications. Thermal oxidation basics. Manufacturing methods and equipment. Measurement methods (mechanical, optical, electrical). Deal-Grove model (linear parabolic model).

E N D
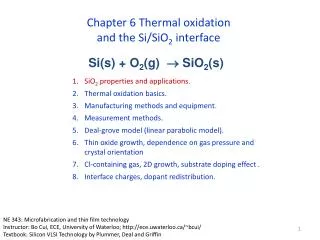
Chapter 6 Thermal oxidation and the Si/SiO2 interface SiO2 properties and applications. Thermal oxidation basics. Manufacturing methods and equipment. Measurement methods (mechanical, optical, electrical). Deal-Grove model (linear parabolic model). Thin oxide growth, dependence on gas pressure and crystal orientation. Cl-containing gas, 2D growth, substrate doping effect . Interface charges, dopant redistribution, rapid thermal oxidation. NE 343: Microfabrication and thin film technology Instructor: Bo Cui, ECE, University of Waterloo; http://ece.uwaterloo.ca/~bcui/ Textbook: Silicon VLSI Technology by Plummer, Deal and Griffin
Thin oxide growth • The Deal-Grove model provides excellent agreement with experimental data except for thin (<20nm) SiO2 grown in dry O2. • When using the D-G equations for thick oxides grown in O2 on bare Si (Xi=0), one needs to “assume” Xi=25nm. • Or equivalently, one can use (0) to correct the Deal-Grove model to compensate for the excess growth that occurs in the initial growth regime. D-G (τ= 40hr) 25nm D-G (τ= 0)
Mechanism for initial oxidation regime • Models to explain the excess growth of thin oxidation • An electric field exists across oxide that enhances diffusion (if diffusing species is O2-, but it is not.) during early states of oxidation. • Thin micro-channels in oxide aid in the movement of O2 to the Si surface. • Mismatch in thermal expansion coefficients of oxide and Si causes stress in oxide and this stress may enhance the diffusivity of the oxidizing species. • But NONE of these mechanism gained wide acceptance. The exact mechanism is still unknown.
Model of Massoud et. al. For D-G model: Massoud model: C=C0exp(-EA/kT) C03.6×108m/hr EA 2.35 eV L 7 nm For Xo>>7nm, Massoud model approaches DG model.
High gas pressure oxidation (111) -------- (100) t=1hr 920oC 750oC Oxide thickness (m) steam Steam pressure (atm)
High gas pressure oxidation • High pressure increases the oxide growth rate, by increasing the linear and parabolic rate constants, which arises from the increased C* (=HPG). • Both B/A and B is proportional to PG, the gas pressure. • Up to 25atm, to reduce temperature/thermal budget in thick oxide fabrication • P=1atm leads to T=-30oC for the same oxidation rate. • Or, to grow a given oxide thickness at same temperature, time can be reduced. • However, still not used in the VLSI fabrication, due to safety concerns at high pressure, as well as reduced film thickness uniformity. Experiment shows that: For H2O oxidation, the growth rate is proportional to PG. For O2 oxidation, the relationship is not linear. n=0.7 – 0.8 Here “i” indicate the value at 1atm. Wet oxidation Dry oxidation
Dependence on crystal orientation Oxidation rate depends on the availability of reaction sites on the silicon substrate. Oxidation on the <111> crystal plane occurs at a higher rate because there are a higher number of surface atoms/chemical bonds than the <100> plane. Most IC made of <100> silicon.
Dependence on crystal orientation KS0 is a constant, roughly proportional to the number of available Si bonds for reaction per unit area. • Interface reaction rate constant Ks (cm/sec) depends on crystal orientation. • So the liner grown rate B/A depends on crystal orientation. (B/A)111= 1.68 (B/A)100 • (1.68 1.227/0.707=1.735, see previous slide) • The parabolic rate constant B is NOT dependent on crystal orientation. • So this effect decreases for high temperature and/or long time oxidation when oxide become thick. Figure 6-27 Simulation, (100) Si, in H2O at 900C for 30 min
Chapter 6 Thermal oxidation and the Si/SiO2 interface SiO2 properties and applications. Thermal oxidation basics. Manufacturing methods and equipment. Measurement methods (mechanical, optical, electrical). Deal-Grove model (linear parabolic model). Thin oxide growth, dependence on gas pressure and crystal orientation. Cl-containing gas, 2D growth, substrate doping effect . Interface charges, dopant redistribution, rapid thermal oxidation. NE 343 Microfabrication and thin film technology Instructor: Bo Cui, ECE, University of Waterloo Textbook: Silicon VLSI Technology by Plummer, Deal and Griffin
Oxidation using Cl-containing gas mixture • Addition of Cl (1-3%) bearing species to oxidation ambient leads to: • Faster oxide growth. Both B/A and B increases, because bond energy of Si-O is 4.25eV, Si-Cl is 0.5eV, so Cl2 reacts with Si first to form Si-Cl, which then reacts with O2 to form SiO2. Here Cl2 is a kind of catalyst. • Cleaner oxide, less metallic contamination, since Cl is a metal getter. Most heavy metal atoms react with Cl to form volatile metal chloride. Metallic contaminants originate from heating elements and insulation around the fused silica flow tube in which the oxidation is done. • Enhanced dielectric strength, reduced oxide density, improved Si/SiO2 interface with lower interface state density, thus improved device performance. • Chlorine species: • Anhydrous chloride (CI2) • Anhydrous hydrogen chloride (HCI) • Trichloroethylene – TCE (C2HCl3) • Trichloroethane – TCA (C2H3Cl3)
Oxidation using Cl-containing gas mixture The generated H2O makes the growth B faster (?) Parabolic rate constant B (m2/hr) Linear rate constant B/A (m/hr) HCl concentration (vol. %) HCl concentration (vol. %)
Two dimensional oxidation • Experiment shows that: • Oxidation is slower for convex or concave corners. • Concave corner is even slower than convex corner. • The smaller the curvature radius is, the slower. • More serious for low temperature oxidation, no effect for high temperature 1200oC (when oxide can “flow”). Figure 6-29 Experiment Drawing to show the structure
Fabrication steps for the structure in previous slide Etch Si ring by reactive ion etching. Side view Grow oxide and deposit poly-silicon Polish
Two dimensional oxidation mechanism • Several physical mechanisms are important in explaining these results. • Crystal orientation dependant rate. • 2D oxidant diffusion (different from 1D). • Stress due to volume expansion (we know when Si oxidizes, it expands). As the oxide grows, the “newly” formed oxide pushes out the “old” oxide which rearranges itself through viscous flow. Stress occurs typically on curved surfaces. • To model the stress effects, Kao et. al. suggested modifying the Deal Grove parameters. Newly grown SiO2 SiO2 Si Top view
Effect of stress n and t are stress along normal and tangential direction. P is the hydrostatic pressure in the growing oxide. VR, VT , VD and VS(0) are volume fitting parameters. Sheer stress in oxide Viscosity of SiO2 Stress-independentviscosity (You are not required to remember or well understand those equations)
Dopant dependence Common Si dopants all tend to enhance oxidation rate of Si when present in the substrate in high concentrations. The effect is particularly important at lower temperatures and for thinner oxides, and is more important for N+ doping than P+ doping. The oxidation rate depends on: The dopant concentration in SiO2 for diffusion controlled oxidation (B dominates). The dopant concentration at Si surface for reaction controlled oxidation (B/A dominates). B segregates into oxide, weakens SiO2 bond structure, increases oxidant diffusivity D.
Dopant dependence: phosphorus • Phosphorous piles up at Si surface, leads to more vacancies in Si (oxidation process need space/vacancies), enhances oxidation rate in the reaction controlled regime (increase ks). • Linear rate coefficient increases rapidly for surface doping levels greater than 1020/cm3. • Parabolic rate coefficient B shows only modest increases. 5 thicker for the heavily doped region (right side) than lightly doped region (left side) 2 thicker
Chapter 6 Thermal oxidation and the Si/SiO2 interface SiO2 properties and applications. Thermal oxidation basics. Manufacturing methods and equipment. Measurement methods (mechanical, optical, electrical). Deal-Grove model (linear parabolic model). Thin oxide growth, dependence on gas pressure and crystal orientation. 2D growth, Cl-containing gas, substrate doping effect. Interface charges, dopant redistribution, rapid thermal oxidation. NE 343 Microfabrication and thin film technology Instructor: Bo Cui, ECE, University of Waterloo Textbook: Silicon VLSI Technology by Plummer, Deal and Griffin
Oxide charge definitions • Interface trapped charge (Qit): located at Si/SiO2 interface. • Fixed oxide charge (Qf): positive charge located within 3nm of Si/SiO2 interface. • Oxide trapped charges (Qot): associated with defects in the SiO2. • Mobile ionic charges (Qm): result from contamination from Na or other alkali ions.
Fixed oxide charges (Qf) • Located in the oxide within approximately 3nm of the SiO2/Si interface. • Qf cannot be charged or discharged easily (unchanged during device operation), and it is reproducible/predictable. • It is positive charge, with density 109-1011/cm2. • It is due to incomplete oxidation of Si. • Qf depends on temperature, smaller for higher temperature. • Smaller Qf for faster cooling or cooling down in inert gas N2 or Ar. • Addition of Cl-containing gas also reduces Qf. • Qf<111> : Qf<110> : Qf<100>=3 : 2 : 1 Si· This is why IC uses <100> Si.
Interface trapped charge (state) Qit • Energy of those interface states are within the band gap, so Qit can be positive, negative or neutral, depending on bias voltage. (i.e. those states can be filled with electrons or holes) • They originate from structural defects related to the oxidation process, metallic impurities, and bond-breaking processes (dangling bond Si·). • It has the same origin as Qf, so high Qf always means high Qit. Low temperature hydrogen (“forming gas”, 10% H2 + 90% N2) anneal at 400-450oC after metallization process effectively neutralizes most interface-trapped charges.
Mobile ionic charge Qm • Mobile ion charges (Qm) are attributed to alkali ions such as Na, K, and Li, as well as negative ions and heavy metals. • It can shift MOSFET threshold voltage and cause device stability problems. • It can be anywhere in the oxide layer, can move at high temperature or bias voltage. • They originate from processing materials, chemicals, ambient, or handling. • Common techniques employed to minimize Qm include: • Cleaning the furnace tube in a chlorine ambient • Addition of cl-containing gas during oxidation • Gettering with phospho-silicate glass (PSG) to replace quartz tube • Using masking layers such as Si3N4 to prevent the contaminants from getting into the oxide. • It was a big problem in 1960s, nowadays no longer a serious issue.
Oxide trapped charge (state) Qot • Oxide-trapped charges (Qot) may be positive or negative, due to holes or electrons being trapped in the bulk of the oxide. • It is caused by broken Si-O, Si-H or Si-OH bonds, due to ionization irradiation and other energetic processes during evaporation (generate x-ray for e-beam evaporation), sputtering (plasma), RIE and ion implantation. • They can be annealed out by low-temperature (300oC) treatment in H2 or inert gas. • 1000oC dry oxidation improves oxide structure and make it less susceptible to irradiation. • Oxide can also be protected from irradiation by covering with Al2O3 and Si3N4that are resistant to irradiation. • Qotreceived more attention in recent years because, as the device shrinks, the electric field within the oxide is increased. The high field may cause electrons to inject to the traps in the oxide (charge trapping), which shifts the threshold voltage.
Dopant re-distribution during oxidation • The ratio of the equilibrium concentration of the impurity in silicon to that in SiO2 at the interface is called the equilibrium segregation coefficient. • Two additional factors influence the redistribution process: • The diffusivity of the impurity in the oxide (if large, the dopant can diffuse through the oxide rapidly, thereby affecting the profile near the Si-SiO2 interface). • The rate at which the interface moves with respect to the diffusion rate.
Four cases of interest Dopant piling up near Si interface
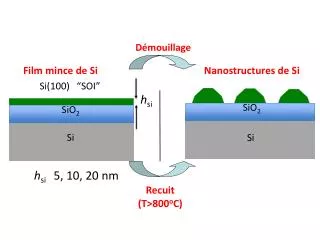
Rapid thermal oxidation (RTO) • Conventional thermal oxidation for gate oxides < 30 Å must be performed at < 800°C, which increases Si/SiO2 interfacial roughness and reduces channel mobility. • Solution: RTO at around 1050°C using radiation heating source, time can be < 1min. • RTO also reduces dopant re-distribution. • RTO may be influenced by both thermally activated processes and a photon-induced process involving mono-atomic O atoms generated by UV, thus creating a parallel oxidation reaction that dominates at lower temperature. • RTO growth kinetics exhibit activation energies differing from conventionally grown oxides. • In the initial stage (20 seconds), the RTO growth rate is linear followed by nonlinear growth. Duration of the linear region is hardware dependent, particular the heating source. Halogen lamps