Download
1 / 23
230 likes | 386 Vues
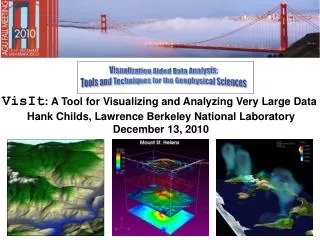
27B element Rayleigh-Taylor Instability (MIRANDA, BG/L). 2 billion element Thermal hydraulics (Nek5000, BG/P). The Challenges Ahead for Visualizing and Analyzing Massive Data Sets. 2 trillion element mesh. Hank Childs Lawrence Berkeley National Laboratory & UC Davis February 26, 2010.

E N D
27B element Rayleigh-Taylor Instability (MIRANDA, BG/L) 2 billion element Thermal hydraulics (Nek5000, BG/P) The Challenges Ahead for Visualizing and Analyzing Massive Data Sets 2 trillion element mesh Hank Childs Lawrence Berkeley National Laboratory & UC Davis February 26, 2010
Overview of This Mini-Symposium • Childs: visualization and analysis will be a crucial problem on the next generation of supercomputers • Pugmire: we can make our algorithms work at massive scale • Peterka: we can visualize the results on the supercomputer itself • Bremer: we can understand and gain insight from these massive data sets
How does the {peta-, exa-} scale affect visualization? High-res meshes • Your mileage may vary • Are you running full machine? • How much data do you output? Large # of variables Large ensembles Large # of time steps
P2 P4 P1 P3 P0 P5 P8 P7 P6 P9 The soon-to-be “good ole days” … how visualization is done right now Parallel Simulation Code Parallelized visualization data flow network Read Process Render Processor 0 Read Process Render P0 P1 P2 P3 Processor 1 P4 P5 P6 P7 Read Process Render Pieces of data (on disk) P8 P9 Processor 2
Vis is almost always >50% I/O and sometimes 98% I/O Amount of data to visualize is typically O(totalmem) Relative I/O (ratio of total memory and I/O) is key “Petascale machine” Terascale machine Pure parallelism performance is based on # bytes to process and I/O rates. Memory I/O FLOPs
Time to write memory to disk Anedoctal evidence: relative I/O is getting slower.
“I/O doesn’t pay the bills” And I/O is becoming a dominant cost in the overall supercomputer procurement. Simulation codes aren’t as exposed. Why is relative I/O getting slower?
1TZ 16K, 32K Dawn Franklin Cray XT4 #cores Problem Size Type Machine 8K 0.5TZ AIX 16K 1TZ Purple Ranger BG/P 4TZ 64K Sun Linux Cray XT5 2TZ JaguarPF Juno Linux 1TZ, 2TZ 16K 32K Recent runs of trillion cell data sets provide further evidence that I/O dominates • Weak scaling study: ~62.5M cells/core 2T cells, 32K procs on Jaguar • Approx I/O time: 2-5 minutes • Approx processing time: 10 seconds 2T cells, 32K procs on Franklin 8
Millions of pixels Visualization works because it uses the brain’s highly effective visual processing system. But is this still a good idea at the peta-/exascale? • (Note that visualization is often reducing the data … so we are frequently *not* trying to render all of the data points.) Trillions of data points
Visualization works because it uses the brain’s highly effective visual processing system. One idea: add more pixels! Trillions of data points 35M pixel powerwall • Bonus: big displays act as collaboration centers.
Visual acuity of the human eye is <30M pixels!! Source: Sawant & Healey, NC State Visualization works because it uses the brain’s highly effective visual processing system. One idea: add more pixels! Trillions of data points 35M pixel powerwall
Summary: what are the challenges? • Scale • We can’t read all of the data at full resolution any more? What can we do? • Insight • How are we going to understand it? • (There is a lot more data than pixels!)
How can we deal with so many cells per pixel? • What should the color of this pixel be? • “Random” between the 9 colors? • An average value of the 9 colors? (brown) • The color of the minimum value? • The color of the maximum value? • We need infrastructure to allow users to have confidence in the pictures we deliver. A single pixel Data insight often goes far beyond pictures (see Bremer talk)
P2 P4 P1 P3 P0 P5 P8 P7 P6 P9 Multi-resolution techniques use coarse representations then refine. Parallelized visualization data flow network Parallel Simulation Code Read Process Render P2 Processor 0 Read Process Render P4 P0 P1 P2 P3 Processor 1 P4 P5 P6 P7 Read Process Render Pieces of data (on disk) P8 P9 Processor 2
Summary: “Dive” into data Enough diving results in original data Pros Avoid I/O & memory requirements Confidence in pictures; multi-res hierarchy addresses “many cells to one pixel issue” Cons Is it meaningful to process simplified version of the data? How do we generate hierarchical representations? What costs do they incur? Multi-resolution: pros and cons
P2 P4 P1 P3 P0 P5 P8 P7 P6 P9 In situ processing does visualization as part of the simulation. Parallel Simulation Code Read Process Render Processor 0 Read Process Render P0 P1 P2 P3 Processor 1 P4 P5 P6 P7 Read Process Render Pieces of data (on disk) P8 P9 Processor 2
P2 P4 P1 P3 P0 P5 P8 P7 P6 P9 In situ processing does visualization as part of the simulation. Parallelized visualization data flow network Parallel Simulation Code GetAccess ToData Process Render Processor 0 GetAccess ToData Process Render Processor 1 GetAccess ToData Process Render Processor 2 … … … … GetAccess ToData Process Render Processor 9
Pros: No I/O! Lots of compute power available Cons: Very memory constrained Many operations not possible Once the simulation has advanced, you cannot go back and analyze it User must know what to look a priori Expensive resource to hold hostage! In situ: pros and cons
Three primary use cases: Exploration Confirmation Communication Now we know the tools … what problem are we trying to solve? Multi-res Examples: Scientific discovery Debugging Examples: Data analysis Images / movies Comparison In situ Examples: Data analysis Images / movies
Prepare for difficult conversations in the future. • Multi-resolution: • Do you understand what a multi-resolution hierarchy should look like for your data? • Who do you trust to generate it? • Are you comfortable with your I/O routines generating these hierarchies while they write? • How much overhead are you willing to tolerate on your dumps? 33+%? • Willing to accept that your visualizations are not the “real” data?
Prepare for difficult conversations in the future. • In situ: • How much memory are you willing to give up for visualization? • Will you be angry if the vis algorithms crash? • Do you know what you want to generate a priori? • Can you re-run simulations if necessary?
Summary: The Five Stages of Grief • Denial: Is there a problem with massive data? • Yes, I/O is a major problem • Yes, obtaining insight is a major problem • Anger: Why is there a problem? Who’s fault is it? • As we scale up, some things get cheap, others things (like I/O) stay expensive • Bargaining: What can we do about it? • Multi-res / in-situ • Depression: Will it hurt? • Yes. • Acceptance: Can we do it? • Yes, see next three talks
Questions??? • Hank Childs, LBL & UC Davis • Contact info: • hchilds@lbl.gov / childs@cs.ucdavis.edu • http://vis.lbl.gov/~hrchilds