Download
1 / 42
450 likes | 495 Vues
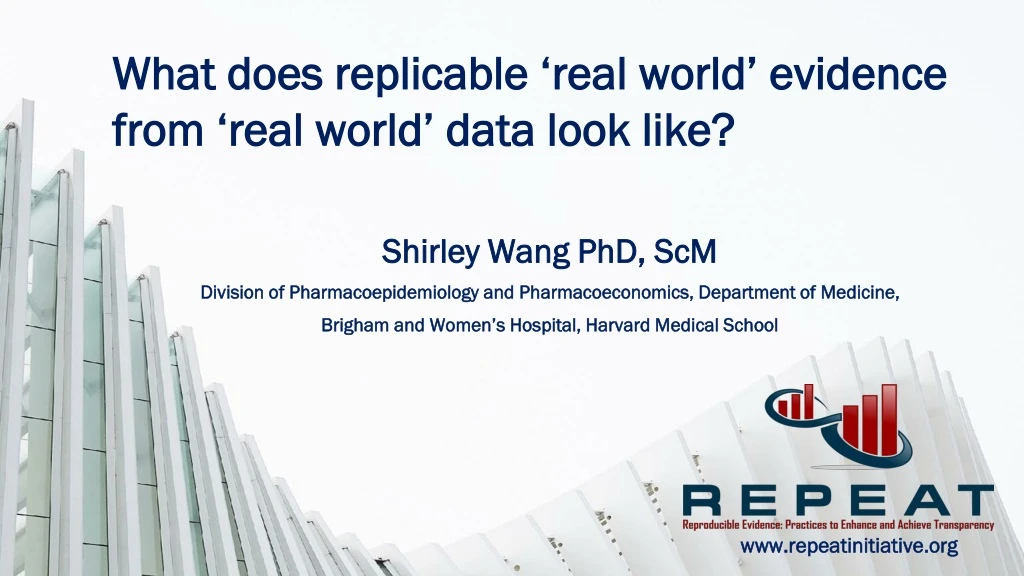
What does replicable ‘real world’ evidence from ‘real world’ data look like?. Shirley Wang PhD, ScM Division of Pharmacoepidemiology and Pharmacoeconomics , Department of Medicine, Brigham and Women’s Hospital, Harvard Medical School. www.repeatinitiative.org. Disclosures.

E N D
What does replicable ‘real world’ evidence from ‘real world’ data look like? Shirley Wang PhD, ScM Division of Pharmacoepidemiology and Pharmacoeconomics, Department of Medicine, Brigham and Women’s Hospital, Harvard Medical School • www.repeatinitiative.org
Disclosures • This work was funded by the Laura and John Arnold Foundation • At the time that this work was conducted, Dr. Wang was principal investigator on other grants from: • Agency for Healthcare and Research Quality • National Institute of Aging • FDA Sentinel Initiative • Investigator initiated grants to Brigham and Women’s Hospital from Novartis, J & J, Boehringer Ingelheim for unrelated work • She has been a consultant for Aetion Inc.
Reproducibility is a cornerstone of the scientific method • Concerns about irreproducible research across many scientific fields • Biomedical: Pre-clinical, Clinical • Other: Psychology, economics… “35%…re-analyses implied [different] conclusions” 40% “success” 60% “success”
‘Real World’ Evidence from ‘Real World’ Data Non-Interventional Interventional Prospective cohorts Some registries Phase I trial Phase II-IV trials Single arm trial Pragmatic trials Hypothesis-Evaluating Treatment Effect Studies Primary data • Follow on studies, some registries RWE using routinely collected data Follow on studies Secondary data • 21st Century Cures Act • PDUFA VI • Adaptive Pathways When and how can we use RWE from RWD to support approval of new indications for drugs already on the market or meet other post-approval study requirements?
Why is clarity of reporting for database studies important? Lack of clarity in reporting is a barrier to use of ‘real world’ evidence from databases for decision making • With high ambiguity about how, unable to assess validity/relevance Transparent & Reproducible Decision about Benefit/Harm/Value Valid, Robust & Transportable Harvard / Brigham Division of Pharmacoepidemiology and Pharmacoeconomics
Clarity in reporting is closely related to reproducibility • Low ambiguity in the scientific process increases • reproducibility • understanding of reasons for divergence in evidence • Credibility of RWE from RWD has suffered from apparent divergence between… Database studies (apparently) investigating the same question Database studies and trials
What does reproducibility mean for database studies? Harvard / Brigham Division of Pharmacoepidemiology and Pharmacoeconomics
What does reproducibility mean for database studies? Hazard ratio = 2.0 Hazard ratio = 2.0 Hazard ratio = 2.0 Important but not transparent by itself Thousands of lines of code to create a temporally anchored analytic cohort from raw longitudinal data streams What scientific decisions is the code implementing? Agree with the validity and/or relevance for the question of interest? Harvard / Brigham Division of Pharmacoepidemiology and Pharmacoeconomics
What does reproducibility mean for database studies? Independently recreate temporally anchored analytic cohort and analysis from source relational database Transparency Direct replication Unambiguous reporting of design and implementation decisions is a necessary pre-condition for direct replication If the “recipe” is clear enough, no reason to expect differences in result • Ability to independently directly replicate a study is a proxy for clear reporting Need clarity to assess validity and relevance of evidence Harvard / Brigham Division of Pharmacoepidemiology and Pharmacoeconomics
What does reproducibility mean for database studies? Most common, most interesting? Why do results differ or converge? Need clarity to understand • Subtle implementation differences • in design • in data • in population Harvard / Brigham Division of Pharmacoepidemiology and Pharmacoeconomics
Existing Guidance FDA Best Practices for Conducting and Reporting Pharmacoepidemiologic Safety Studies Using Electronic Healthcare Data (2013) EMA Guideline on good pharmacovigilance practices GVP Module 8 Each protocol and final report should include a study title that indicates the type of pharmacoepidemiologic safety study design (e.g., cohort, case-control) employed in the study. The report should contain a detailed study summary that concisely describes the critical elements listed below. Scientific goals, study objectives, and prespecified hypotheses; Study design, including comparator groups; Study population and time period of study, including: (1) study time frame and (2) scheduled milestones (final protocol submission, study completion, and the final report); Data sources used; Drug exposures of interest; Drug safety outcomes of interest; Methods to control for sources of bias and confounding; Statistical analysis plan; Brief, balanced description of the results, interpretation of study findings, and key study limitations; and Public health impact. • Detailed study summary that concisely describes…critical elements • Clear operational definitions for exposures, outcomes, confounders, effect modifiers • Use a diagram to illustrate key aspects RECORD-PE Others… ISPE Good Pharmacoepidemiology Practices Protocol Development
Recent steps to increase transparency about how RWE is generated The International Society for Pharmacoeconomics and Outcomes Research (ISPOR)/ International Society for Pharmacoepidemiology (ISPE) Joint Task Force on Real World Evidence for Healthcare Decision-Making transparency in process for database studies (e.g. “what did you plan to do?”) clarity of study execution(e.g. “what did you actually do?) Harvard / Brigham Division of Pharmacoepidemiology and Pharmacoeconomics
Recent steps to increase transparency about how RWE is generated The International Society for Pharmacoeconomics and Outcomes Research (ISPOR)/ International Society for Pharmacoepidemiology (ISPE) Joint Task Force on Real World Evidence for Healthcare Decision-Making transparency in process for database studies (e.g. “what did you plan to do?”) clarity of study execution(e.g. “what did you actually do?) Harvard / Brigham Division of Pharmacoepidemiology and Pharmacoeconomics
Specific reporting to improve clarity, reproducibility and facilitate validity assessment DATA SOURCE • Data provider • Data extraction date (DED)* • Data sampling • Source data range (SDR)* • Type of data • Data linkage, other supplemental data • Data cleaning • Data model conversion DESIGN • Design diagram INCLUSION/EXCLUSION CRITERIA • Study entry date (SED)* • Person or episode level study entry • Sequencing of exclusions • Enrollment window (EW)* • Enrollment gap • Inclusion/Exclusion definition window • Codes • Frequency and temporality of codes] • Diagnosis position (if relevant/available) • Care setting • Washout for exposure • Washout for outcome CONTROL SAMPLING • Sampling strategy • Matching factors • Matching ratio EXPOSURE DEFINITION • Type of exposure • Exposure risk window (ERW) • Induction period • Stockpiling • Bridging exposure episodes • Exposure extension • Switching/add on z • Codes, frequency and temporality of codes, diagnosis position, care setting • Exposure Assessment Window (EAW)* FOLLOW UP TIME • Follow-up window (FW)* • Censoring criteria OUTCOME DEFINITION • Event date (ED)* • Validation • Codes, frequency and temporality of codes, diagnosis position, care setting COVARIATE DEFINITIONS • Covariate assessment window (CW)* • Comorbidity/risk score • Healthcare utilization metrics • Codes, frequency and temporality of codes, diagnosis position, care setting STATISTICAL SOFTWARE • Statistical software program used * key temporal anchors
Specific reporting to improve clarity, reproducibility and facilitate validity assessment DATA SOURCE • Data provider • Data extraction date (DED)* • Data sampling • Source data range (SDR)* • Type of data • Data linkage, other supplemental data • Data cleaning • Data model conversion DESIGN • Design diagram INCLUSION/EXCLUSION CRITERIA • Study entry date (SED)* • Person or episode level study entry • Sequencing of exclusions • Enrollment window (EW)* • Enrollment gap • Inclusion/Exclusion definition window • Codes • Frequency and temporality of codes] • Diagnosis position (if relevant/available) • Care setting • Washout for exposure • Washout for outcome CONTROL SAMPLING • Sampling strategy • Matching factors • Matching ratio EXPOSURE DEFINITION • Type of exposure • Exposure risk window (ERW) • Induction period • Stockpiling • Bridging exposure episodes • Exposure extension • Switching/add on z • Codes, frequency and temporality of codes, diagnosis position, care setting • Exposure Assessment Window (EAW)* FOLLOW UP TIME • Follow-up window (FW)* • Censoring criteria OUTCOME DEFINITION • Event date (ED)* • Validation • Codes, frequency and temporality of codes, diagnosis position, care setting COVARIATE DEFINITIONS • Covariate assessment window (CW)* • Comorbidity/risk score • Healthcare utilization metrics • Codes, frequency and temporality of codes, diagnosis position, care setting STATISTICAL SOFTWARE • Statistical software program used * key temporal anchors
Example of simple design diagram Cohort Entry Date (First prescription of ACE-I or ARB - tablet) Day 0 A cohort study to evaluate the risk of angioedema with angiotensin converting enzyme inhibitors (ACE-I) versus angiotensin II receptor blockers (ARB) Inclusion Assessment Window (Continuous medical and drug coveragea) Days [-183, 0] Washout Window (exposure, outcome) (No ACE-I, ARB, Angioedema) Days [-183, -1] Exclusion Assessment Window (Age ≤ 18, initiate both ACE and ARB) Days [0, 0] Covariate Assessment Window (Age, sex) Days [0, 0] Covariate Assessment Window (Baseline conditionsb) Days [-183, 0] Follow up Window Days [0, Censorc] Time Up to 45 day gaps in medical or pharmacy enrollment allowed Baseline conditions included: allergic reactions, diabetes, heart failure, ischemic heart disease, non-steroidal anti-inflammatory drugs Earliest of: outcome of interest (angioedema), switching or discontinuation of study drugs, death, disenrollment, 365 days of follow-up, end of the study period Toh S, et al Arch Intern Med. 2012 Schneeweiss S, et al Annals. 2019
Specific reporting to improve clarity, reproducibility and facilitate validity assessment DATA SOURCE • Data provider • Data extraction date (DED)* • Data sampling • Source data range (SDR)* • Type of data • Data linkage, other supplemental data • Data cleaning • Data model conversion DESIGN • Design diagram INCLUSION/EXCLUSION CRITERIA • Study entry date (SED)* • Person or episode level study entry • Sequencing of exclusions • Enrollment window (EW)* • Enrollment gap • Inclusion/Exclusion definition window • Codes • Frequency and temporality of codes] • Diagnosis position (if relevant/available) • Care setting • Washout for exposure • Washout for outcome CONTROL SAMPLING • Sampling strategy • Matching factors • Matching ratio EXPOSURE DEFINITION • Type of exposure • Exposure risk window (ERW) • Induction period • Stockpiling • Bridging exposure episodes • Exposure extension • Switching/add on z • Codes, frequency and temporality of codes, diagnosis position, care setting • Exposure Assessment Window (EAW)* FOLLOW UP TIME • Follow-up window (FW)* • Censoring criteria OUTCOME DEFINITION • Event date (ED)* • Validation • Codes, frequency and temporality of codes, diagnosis position, care setting COVARIATE DEFINITIONS • Covariate assessment window (CW)* • Comorbidity/risk score • Healthcare utilization metrics • Codes, frequency and temporality of codes, diagnosis position, care setting STATISTICAL SOFTWARE • Statistical software program used * key temporal anchors
Example specificity defining exposure D.1. Type of exposure (e.g. incident, cumulative, time-varying) D.2. Exposure risk window D.2a Induction period D.2b Stockpiling D.2c Bridging exposure episodes D.2d Exposure extension D.3 Switching, Add on D4. Codes • Frequency and temporality • Diagnosis position • Care setting Follow up Days supply Days supply Days supply Days supply Wang 2017, ISPE/ISPOR Joint Task Force
Where are we now? How can we improve?Focusing on non-randomized healthcare database studies Project Objective: To evaluate the current state of: • Reporting clarity • Reproducibility • Robustness/transportability Longer Term Objective: Work with key stakeholders to develop empirically based standards and processes that improve transparency, reproducibility and robustness of evidence Harvard / Brigham Division of Pharmacoepidemiology and Pharmacoeconomics
Measuring clarity of reporting and direct replicability Identify random sample • Peer reviewed publications • Descriptive, comparative effectiveness or safety study • Conducted using healthcare databases Evaluate reporting clarity (N = 250) • Using standardized extraction form • Based on ISPOR-ISPE Joint Task Force catalogue • Same data source • Same years of data • Same methods (with assumptions when unclear) • Blind to original results Directly replicate (N = 150) Contact original investigators • Discuss assumptions • Understand differences Robustness evaluation • Different • Implementation decisions • Data/population Harvard / Brigham Division of Pharmacoepidemiology and Pharmacoeconomics
Measuring clarity of reporting and direct replicability Identify random sample • Peer reviewed publications • Descriptive, comparative effectiveness or safety study • Conducted using healthcare databases Evaluate reporting clarity (N = 250) • Using standardized extraction form • Based on ISPOR-ISPE Joint Task Force catalogue • Same data source • Same years of data • Same methods (with assumptions when unclear) • Blind to original results Directly replicate (N = 150) Contact original investigators • Discuss assumptions • Understand differences Robustness evaluation • Different • Implementation decisions • Data/population Harvard / Brigham Division of Pharmacoepidemiology and Pharmacoeconomics
Measuring clarity of reporting and direct replicability Identify random sample • Peer reviewed publications • Descriptive, comparative effectiveness or safety study • Conducted using healthcare databases Evaluate reporting clarity (N = 250) • Using standardized extraction form • Based on ISPOR-ISPE Joint Task Force catalogue • Same data source • Same years of data • Same methods (with assumptions when unclear) • Blind to original results Directly replicate (N = 150) Contact original investigators • Discuss assumptions • Understand differences Robustness evaluation • Different • Implementation decisions • Data/population Harvard / Brigham Division of Pharmacoepidemiology and Pharmacoeconomics
Measuring clarity of reporting and direct replicability Identify random sample • Peer reviewed publications • Descriptive, comparative effectiveness or safety study • Conducted using healthcare databases Evaluate reporting clarity (N = 250) • Using standardized extraction form • Based on ISPOR-ISPE Joint Task Force catalogue • Same data source • Same years of data • Same methods (with assumptions when unclear) • Blind to original results Directly replicate (N = 150) Contact original investigators • Discuss assumptions • Understand differences Robustness evaluation • Different • Implementation decisions • Data/population Harvard / Brigham Division of Pharmacoepidemiology and Pharmacoeconomics
Measuring clarity of reporting and direct replicability Identify random sample • Peer reviewed publications • Descriptive, comparative effectiveness or safety study • Conducted using healthcare databases Evaluate reporting clarity (N = 250) • Using standardized extraction form • Based on ISPOR-ISPE Joint Task Force catalogue • Same data source • Same years of data • Same methods (with assumptions when unclear) • Blind to original results Directly replicate (N = 150) Contact original investigators • Discuss assumptions • Understand differences Robustness evaluation • Different • Implementation decisions • Data/population
Replication Highlights: Analytic Cohort Differences in binary/categorical characteristics* of cohort(publication – replication) Interim Results Table 1 Publication Table 1 Replication - • Average difference = 0.0 • 85% of prevalence differences between original and replication were within ± 10% points Difference • Authors provided citation to comorbidity score • All patients in replication had score ≥ 2 because tumor/malignancy was part of inclusion • > 75% in original had score = 0 Study ID Covariate codes not reported Covariate codes reported Harvard / Brigham Division of Pharmacoepidemiology and Pharmacoeconomics * binary/categorical
Replication Metrics: Effect Size and Confidence Limits Primary Measures of Interest • Difference in log effect size • “Calibration” of replication versus original publication with correlation coefficient Other Descriptive Measures • Binary measure of agreement • Estimate on same side of null, p-value same side of 0.05 • Confidence interval (CI) overlap Harvard / Brigham Division of Pharmacoepidemiology and Pharmacoeconomics
Primary Replication Metrics: Effect Size and Confidence Limits Interim Results Difference in log effect size (publication – replication) Correlation between effect sizes (publication vs replication) • Correlation coefficient = 0.74 • Mean difference: 0.05 • Relative effect size range [50%, 349%] Publication Replication
Primary Replication Metrics: Effect Size and Confidence Limits Interim Results Difference in log effect size (publication – replication) Correlation between effect sizes (publication vs replication) • Correlation coefficient = 0.74 • Mean difference: 0.05 • Relative effect size range [50%, 349%] Hazard Ratio = 1.5 Publication Replication
Primary Replication Metrics: Effect Size and Confidence Limits Interim Results Difference in log effect size (publication – replication) Correlation between effect sizes (publication vs replication) • Correlation coefficient = 0.74 • Mean difference: 0.05 • Relative effect size range [50%, 349%] Hazard Ratio = 1.5 Publication Hazard Ratio = 1.5 Replication Replication
Primary Replication Metrics: Effect Size and Confidence Limits Interim Results Difference in log effect size (publication – replication) Correlation between effect sizes (publication vs replication) • Correlation coefficient = 0.74 • Mean difference: 0.05 • Relative effect size range [50%, 349%] Publication Replication
Primary Replication Metrics: Effect Size and Confidence Limits Interim Results • Notes from replication team: • Discrepancies between exclusions in manuscript text versus attrition table • Made assumptions regarding algorithms to define exclusion, covariates • Codes? Care setting? Dx position? • Day 0 in assessment window? • Outcome algorithm was in appendix • Sample size and characteristics: • Replication cohort was 10% larger • Most replicated baseline characteristics within 10% points • Reported outcome rate in original and replication very different (P vs S?) Difference in log effect size (publication – replication) Correlation between effect sizes (publication vs replication) • Correlation coefficient = 0.74 • Mean difference: 0.05 • Relative effect size range [50%, 349%] Hazard ratio for major bleeding Original: 1.9 Replication: 3.4 Publication Replication
Primary Replication Metrics: Effect Size and Confidence Limits Interim Results Difference in log effect size (publication – replication) Correlation between effect sizes (publication vs replication) • Notes from replication team: • Assumptions regarding algorithms for exclusion, covariates • Codes? Care setting? Dx position? • Day 0 in assessment window? • Outcome algorithm provided • Assumptions about follow up • Censoring criteria, exposure stockpiling, bridging, extension • Sample size and characteristics: • Replication cohort was 30% larger • Over half of baseline characteristics differed by more than 10% points • Correlation coefficient = 0.74 • Mean difference: 0.05 • Relative effect size range [50%, 349%] Hazard ratio for bleeding Original: 1.2 (95% excludes null) Replication: 0.8 (95% include null) Publication Replication
Other Replication MetricsEffect estimates¹ and CI for publication versus direct replication Interim Results Harvard / Brigham Division of Pharmacoepidemiology and Pharmacoeconomics
Other Replication MetricsEffect estimates¹ and CI for publication versus direct replication Interim Results Planned evaluation: How much do various factors explain differences between replication and original? • Clarity of reporting on specific types of parameters • Journal impact factor • Funding source • Author experience (h-index) • Time • … Harvard / Brigham Division of Pharmacoepidemiology and Pharmacoeconomics
Author responses (out of 49 attempted contacts so far) 33% responded Themes in responses: • I decline to participate • We will respond after carefully reviewing the document… • I have forwarded the documents to the study programmer/sponsor/lead and we would like to schedule a phone call to discuss your assumptions • Here is the algorithm we actually used, and a code snippet • 67% No response yet • 39% considered non-responders after 3 attempts • 21% of e-mails undeliverable • 39% still trying to reach Harvard / Brigham Division of Pharmacoepidemiology and Pharmacoeconomics
REPEAT Conceptual Replication: Quantifying robustness and transportability by examining sources of variation Define the research question (PICOTS) From the REPEAT sample Dabigatran vs. Warfarin on risk of major bleeding in patients with atrial fibrillation Design a matrix of study specifications • Published papers • Parameter variations (ISPOR/ISPE task force) • Multiple data sources Systematically examine sources of variation “Variance Components Analysis” Describe magnitude of differences within and between data source Regression to quantify drivers of variation within and between data source Harvard / Brigham Division of Pharmacoepidemiology and Pharmacoeconomics
Concluding points • There is room for improvement • Exclusion criteria, temporality • Hard to replicate analysis results if unable to replicate cohort Harvard / Brigham Division of Pharmacoepidemiology and Pharmacoeconomics
Concluding points • There is room for improvement • Exclusion criteria, temporality • Hard to replicate analysis results if unable to replicate cohort • Replication results are about clarity of reporting, not validity • Single best attempt based on reported methods with assumptions if parameter(s) unclear • No guarantee • Assumptions aligned with original implementation • Methods in the original publication were valid • Fidelity of code to reporting Highly transparent, replicable study≠ Valid study Harvard / Brigham Division of Pharmacoepidemiology and Pharmacoeconomics
Parallel efforts in progress…Guiding principle: Don’t let perfect be the enemy of good Structured reporting template with design visualization Public/private project including FDA + consortium of sponsors Goals: Increase clarity in reporting of study implementation • Reduce misinterpretation • Simplify reporting • Maximize efficiency (for researchers and reviewers) Pre-registration of Hypothesis Evaluating RWE Multi-stakeholder Steering Group Goals: Increase transparency of research process • Short term: Identify central location for pre-registration • Medium term: Determine what registration will entail (progressive effort) • Long term: Aim for a (near) to complete denominator
REPEAT Core Team (alphabetical) Co-Directed by Shirley V Wang PhD, ScM and Sebastian Schneeweiss MD, ScD 6 groups working in parallel on different studies (1+ faculty, 2+ research staff) • Adrian Ortiz Santiago BS • Ajinkya Pawar PhD MS • Danielle L Isaman MS • Elisabetta Patorno MD DrPH • Elizabeth M. Garry PhD MPH • Emma Payne BS • Gregory Brill • Jessica Franklin PhD • Joan Landon, MPH • Joshua Gagne PharmD ScD • Krista Huybrechts PhD MS • Kristina Stefanini BA • Lily Bessette BS • Liza R Gibbs BS • Mimi Zakarian BS • Monica L. Gierrada MPH • Mufaddal Mahresi MD MPH • Nileesa Gautam BS • Seanna Vine MPH • Sebastian Schneeweiss MD ScD • Shirley V Wang PhD ScM • Sushama Kattinakere MBBS MSPH • Ted Tsacogianis, MPH • Yinzhu Jin MS MPH www.repeatinitiative.org Harvard / Brigham Division of Pharmacoepidemiology and Pharmacoeconomics
K. Arnold Chan MD ScD Karen Burnett MBA MS Kristian Filion PhD FAHA Kris Kahler PhD Laura Happe PharmD MPH Liam Smeeth PhD Lisa Freeman Michael Nguyen MD Nam-Kyong Choi B. Pharm PhD PállJónsson PhD Mres Peter Arlett BSc MBBS MRCP FFPM Peter Tugwell MSc MD FRCPC Richard Platt MD MSc Sarah Priddy Alwardt PhD Sean Hennessy PharmD, PhD Troyen Brennan MD Will Shrank MD Wolfgang Winkelmayer MD MPH ScD FASN Yoshiaki Uyama PhD Scientific Advisory Board (alphabetical) Regulators, HTA, delivery systems, patients, payers, industry, journals, research societies… • Jeffrey Brown PhD • Alison Bourke MSc FRPharm.S • Amr Makady PharmD PhD • Andrew Bate PhD • Brian Bradbury DSc • Brian Nosek PhD • Christine Laine MD MPH FACP • David Martin MD MPH • Deborah Zarin MD • Dick Willke PhD • Dorothee Bartels MSc PhD • Elizabeth Loder MD MPH • Frank de Vries PharmD PhD • Hans-Georg Eichler MD, MSc • Henrik ToftSørensen MD PhD • Javier Jimenez MD MPH • Jesper Hallas MD PhD • Joanne Waldstreicher MD • John Ioannidis MD DSc • John Seeger PharmD DrPh www.repeatinitiative.org Harvard / Brigham Division of Pharmacoepidemiology and Pharmacoeconomics
swang1@bwh.harvard.edu Harvard / Brigham Division of Pharmacoepidemiology and Pharmacoeconomics