Warm – Up Oct. 29, 2009
170 likes | 199 Vues
Warm – Up Oct. 29, 2009. Identify the value of b in each exponential function,. State the domain and range of each function. Domain: All Real #s Range: y > 0. 1/2. 3.5. -2. Domain: All Real #s Range: y < 0. Agenda. Thurs, Oct 29 Exponential Decay. Warm-Up Notes: Exponential Growth.

Warm – Up Oct. 29, 2009
E N D
Presentation Transcript
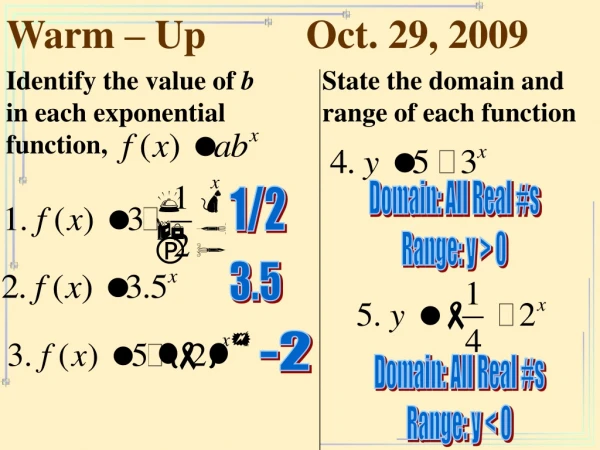
Warm – Up Oct. 29, 2009 Identify the value of b in each exponential function, State the domain and range of each function Domain: All Real #s Range: y > 0 1/2 3.5 -2 Domain: All Real #s Range: y < 0
Agenda Thurs, Oct 29 Exponential Decay • Warm-Up • Notes: Exponential Growth Fri, Oct 30 Applications Mon, Nov 2 Quiz: Exponential Growth & Decay
Exponential Decay Function Where a > 0, base b is 0 < b < 1, and x is any real number.
Decide whether f(x) is an exponential growth or exponential decay function. Because 0 < b < 1f is an exponential decay function 1) Becauseb > 1f is an exponential growth function 2) 3) Rewrite the function with positive exponent Because 0 < b < 1f is an exponential decay function
Graphs of Exponential Equations To see the basic shape of an exponential function such as make a table of values and plot points.
Graph f(x) = (½)x x y -3 -2 -1 2 1 0 ½ 1 ¼ 2
Notice the end behavior of the graph. As x → -∞, f(x) → +∞, which means that the graph moves up to the left. As x → +∞, f(x) → 0, which means that the graph has the line y = 0 as an asymptote.
Exponential Decay Function: Where a > 0 and 0 < b < 1 Have these characteristics… The graph passes through the point (0,a) [the y-intercept]. The x-axis is an asymptote of the graph. The domain is all real numbers. The range is y > 0 if a > 0 and y < 0 if a < 0
Exponential Decay Model: Where a is the initial amount and r is the percent decrease The quantity 1- r is called the decay factor
There are 40,000 homes in your city. Each year 10% of the homes are expected to disconnect from septic systems and connect to the sewer system a) Write an exponential decay model for the number of homes that still use septic systems. Use the model to estimate the number of homes using septic systems after 5 years. c) Graph the model and estimate when about 17,200 homes will still be connected to the sewer system.
After about 8 years You can see this better on your table Homeowners using own system years
Home WorkHand out (Alg 2 text: page 477-479)#s 1-24 ALL#s 53-56
Domain: All Real Numbers Domain: All Real Numbers Range: All Positive RealNumbers Range: All Positive RealNumbers
Domain: All Real Numbers Domain: All Real Numbers Range: All Positive RealNumbers Range: y > -3
Domain: All Real Numbers Domain: All Real Numbers Range: y > 2 Range: y > 1
Classwork for Application Day: • Page 134 in Math 3 text book Homework for Application Day: Hand out (Alg 2 text: page 469-471) • #s 49-54 ALL • #s 56-64 ALL • # 67