Download
1 / 18
180 likes | 400 Vues
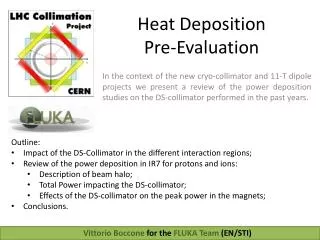
FLUKA simulations of heat deposition with active absorbers in IR6. E.Skordis On behalf of the FLUKA team. With Input from : B.M. Salvachua , B.Goddard. FLUKA geometry of IR6. TCDQs. Q4. Q5. TCSG. Masks. TCLAV Vertical a ctive absorber at 10 sigmas.

E N D
FLUKA simulations of heat deposition with active absorbers in IR6 E.SkordisOn behalf of the FLUKA team With Input from: B.M. Salvachua, B.Goddard E.Skordis
FLUKA geometry of IR6 TCDQs Q4 Q5 TCSG Masks TCLAV Vertical active absorber at 10 sigmas TCLAH Horizontal active absorber at 10 sigmas E.Skordis
Simulations overview Simulate energy deposited in the Q4 and Q5 Magnet coils in IR6 2 scenarios Nominal operation losses Asynchronous Beam Dump losses 2 cases Without Active Absorbers (TCLA) Without Active Absorbers (TCLA) With Active Absorbers (TCLA) With Active Absorbers (TCLA)
Nominal operation Loss map given by 6track simulations (B.M. Salvachua), 2 cases: With and Without TCLA Total losses: • Without TCLA 1809 out of 6391627(0.0283%) • With TCLA 1854 out of 6334006 (0.02927%) Normalisation • 2.2 · 1011 p/bunch • 2808 buncheslost in 1 hour
Q4 0.6 0.1 Gain : a factor of 6 Profile over Z of the maximum energy deposition on the Q4 coils.Values are in mW cm−3Normalisation [2.2 · 1011 p/bunch – 2808 buncheslost in 1 hour * (1854/6.4 · 106 ) ] E.Skordis
Q5 1.3 0.4 Gain : a factor of 3.3 Profile over Z of the maximum energy deposition on the Q5 coils.Values are in mW cm−3Normalisation [2.2 · 1011 p/bunch – 2808 buncheslost in 1 hour * (1854/6.4 · 106 ) ] E.Skordis
Q4 Total Energy deposition Without TCLA : 2.76 W With TCLA : 0.40 W X,Y cross section at the Z of the maximum energy deposition on the Q4Values are in mW cm−3Normalisation [2.2 · 1011 p/bunch – 2808 buncheslost in 1 hour * (1854/6.4 · 106 ) ] E.Skordis
Q5 Total Energy deposition Without TCLA : 2.15 W With TCLA : 0.66 W X,Y cross section at the Z of the maximum energy deposition on the Q5Values are in mW cm−3Normalisation [2.2 · 1011 p/bunch – 2808 buncheslost in 1 hour * (1854/6.4 · 106 ) ] E.Skordis
Total energy deposition on the elements Values are in W Normalisation [2.2 · 1011 p/bunch – 2808 buncheslost in 1 hour * (1854/6.4 · 106 ) ] TCDQs TCSG Positive jaw TCLAV top jaw TCLAH Positive jaw 0.462 0.482 0 4.540 0 1.318 Beam TCSG Negative jaw TCLAV botomjaw TCLAH Negative jaw 1.903 1.924 0 4.502 0 2.135 E.Skordis
Asynchronous Beam Dump • Distribution at a given point in Z before the TCDQs that included x, y, x’, y’ Normalisation: 40 bunches lost , 2.2 · 1011 p/bunch E.Skordis
Q4 10.5 1.8 Gain : a factor of 5.8 Profile over Z of the maximum energy deposition on the Q4 coilsValues are in J cm−3Normalisation [2.2 · 1011 p/bunch – 40 bunches] E.Skordis
Q5 32.9 8.6 Gain : a factor of 3.8 Profile over Z of the maximum energy deposition on the Q5 coilsValues are in J cm−3Normalisation [2.2 · 1011 p/bunch – 40 bunches] E.Skordis
Q4 Total Energy deposition Without TCLA : 49.34 kJ With TCLA : 14.22 kJ X,Y cross section at the Z of the maximum energy deposition on the Q4Values are in J cm−3Normalisation [2.2 · 1011 p/bunch – 40 bunches] E.Skordis
Q5 Total Energy deposition Without TCLA : 32.08 kJ With TCLA : 8.157 kJ X,Y cross section at the Z of the maximum energy deposition on the Q5Values are in J cm−3Normalisation [2.2 · 1011 p/bunch – 40 bunches] E.Skordis
Total energy deposition on the elementsValues are in kJ Normalisation [2.2 · 1011 p/bunch – 40 bunches] TCDQs TCS Positive jaw TCLAV top jaw TCLAH Positive jaw 24.7 24.57 0 73.34 0 15.61 Beam TCS Negative jaw TCLAV botomjaw TCLAH Negative jaw 146.2 147.30 0 73.61 0 16.93 E.Skordis
Simulations Conclusion Simulate energy deposited in the Q4 and Q5 Magnet coils in IR6 2 scenarios Nominal operation losses Asynchronous Beam Dump losses 2 cases Q4 Gain of a factor of: 5.8 Q4 Gain of a factor of: 3.8 Q4 Gain of a factor of: 6 Q5 Gain of a factor of: 3.3
Second mask geometry E.Skordis
Asynchronous Beam Dump Profile over Z of the maximum energy deposition on the Q5 coilsValues are in J cm−3Normalisation [2.2 · 1011 p/bunch – 40 bunches] E.Skordis