Download
1 / 18
190 likes | 337 Vues
Mixing Qualitative and Quantitative Methods of Analyzing Poverty Dynamics. Chris Barrett Cornell University March 11, 2003 SAGA Workshop Nairobi, Kenya. Imperative of Poverty Research. Governments committed to (i) poverty reduction and (ii) increased participation of the

E N D
Mixing Qualitative and Quantitative Methods of Analyzing Poverty Dynamics Chris Barrett Cornell University March 11, 2003 SAGA Workshop Nairobi, Kenya
Imperative of Poverty Research Governments committed to (i) poverty reduction and (ii) increased participation of the poor in priority setting exercises. Need to know: - who are the poor? - whose poverty is chronic, whose transitory? - why are some chronically poor? - what one-off interventions can help put people on an accumulation path out of poverty?
Advances in Poverty Research Significant recent progress in both qualitative (QUAL) and quantitative (QUANT) methods of poverty analysis: - rapid rise of participatory poverty assessment (PPA) methods - emergence of widespread, nationally representative household survey data, notably longitudinal panels
Ongoing Challenge of Poverty Research “Poverty” as a complex, multidimensional concept - Static/dynamic - chronic/transitory - assets vs. income/expenditures - econ/non-economic outcomes - experience/prospect of poverty - outcomes/processes Powerlessness, vulnerability and resource insufficiency central to most conceptualizations … but hard to pin down
So are QUAL and QUANT complements or substitutes?Considerable conflict among practitioners of each … legacy of 80s/90s disciplinary segregation. But do the methods necessarily conflict too???So complex a concept requires iteration between (sequential mixing) or integration of (simultaneous mixing) methods for accurate triangulation.We must learn the lesson of the blind men and the elephant.
Be clear about focus of question:(1) Data collection methods(2) Data types(3) Data analysis methods(4) Audience Dimensions of QUAL-QUANT Difference
Data collection methods Dimensions of QUAL-QUANT Difference Analytical Coverage General Specific Census Random Sample Surveys PRA Autobiography Passive Active Population Involvement in Research
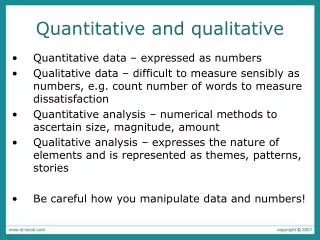
Dimensions of QUAL-QUANT Difference Data types: “Qualitative”“Quantitative” Categorical Ordinal Cardinal Each data collection method can yield both non-numerical and numerical data types
Dimensions of QUAL-QUANT Difference Data analysis methods: “Qualitative”“Quantitative” Inductive Deductive Related to the specific-general data collection methods distinction, there’s often (not always) a difference in analysis methods.
Dimensions of QUAL-QUANT Difference Audience: Local community Or global/national policymakers Local empowerment or the “big picture” and “speaking truth to power”
Myths about QUAL-QUANT differences (1) One more/less extractive than the other (“ethical superiority”) (2) One more/less contextual than the other (“historical superiority”) (3) One inherently numerical/non-numerical (“statistical superiority”) (4) One more “rigorous” than the other (“scientific superiority”) Bad practice is bad practice, whatever the method... Key question: When and how is good practice within one strand still wanting? How can the other fill the blanks?
Mixing Methods Improve analysis by mixing the two … take the “con” out of econometrics and generalize beyond the “part” of participatory methods Harness statistical power of quantitative methods for description/aggregation along with narrative power of qualitative methods for nuanced and textured analysis of complex (unmeasurable?) concepts Triangulation to uncover mechanisms behind poverty
Mixing Methods “Sequential mixing” or “classical integration” Practitioners of each method do their best with their own tools on same problem, sometimes taking outputs from one as intermediate inputs to another. Then triangulate to get an integrated result.
Sequential mixing Example: Understanding welfare transitions (BASIS CRSP) Step 1: Panel survey data collection to construct transition matrices and change measures. Poort Nonpoort Step 2: Draw several households Poort+1 from each of 6 cells in matrix and do detailed oral histories. Nonpoort+1 Why? Capture omitted variables, check transitions, 2nd method of inference, problem of identifying thresholds econometrically, value of stories for policy audiences.
Mixing Methods “Simultaneous mixing” or “Bayesian integration” Iterative approach to using one method to inform another, then back to the first, etc., keeping multiple methods interactive throughout the research process to update researchers’ priors continuously. Feedback loop yields a homeostatic research mechanism: “ethnography” precedes “participatory” which in turn precedes “survey” in dictionary … ought to be the case in the field, too! Ongoing, creative tension between methods helps ensure originality, robustness and relevance of results
Simultaneous mixing Example: improving pastoralists’ risk management (PARIMA) (1) Participatory risk mapping to identify relevant threats: open-ended, spatially-explicit, pseudo-cardinal (2) Quarterly repeated surveys with open-ended sections and mixed modules: (i) complex property rights; climate forecasting, resource conflict; land use history; livelihoods strategies, etc. (ii) complementarity at multiples levels of analysis and different methods (e.g., livestock marketing with data from households, markets and traders) Effective means to ensure inference consistent (i) across methods (a test of robustness) and (i) with local understandings of the problem(s) (a test of relevance)
The Way Forward: Walking On Two Legs Development scholars and practitioners increasingly recognize the complementarity between qualitative and quantitative methods. Best done in multidisciplinary teams with a range of joint and parallel efforts. • Situate participatory poverty appraisals within sampling frame • Introduce more open-ended and subjective questions of causality and interpretation into survey instruments • Explicitly foster self-critique, cross-checking within teams and feedback briefings with different interested parties Nonetheless, much remains to be done (vocabulary, data cross-referencing, respectful dialogue, etc. …