Natural Gas as Transportation Fuel: Revolutionizing North America's Energy Portfolio
Our mission is to promote natural gas as a foundation of North America's energy mix - abundant, clean, reliable, and domestic. North America heavily relies on petroleum for transportation fuel, highlighting the need for alternative options like natural gas. Being economical, domestic, and environmentally friendly, natural gas vehicles offer significant emissions reduction and cost advantages. With a growing market share, government incentives, and a well-established infrastructure, the shift towards natural gas transportation is promising. The different market segments for natural gas vehicles include municipal, commercial, heavy-duty, and off-road applications, showcasing the versatility of this fuel source. Embracing natural gas can lead to cleaner air, reduced greenhouse gas emissions, and lesser dependence on crude oil imports, making it a crucial part of a sustainable energy future.

Natural Gas as Transportation Fuel: Revolutionizing North America's Energy Portfolio
E N D
Presentation Transcript
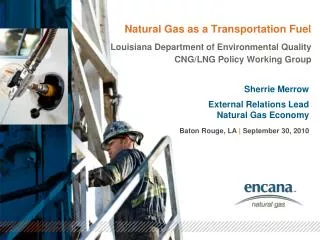
Natural Gas as a Transportation FuelLouisiana Department of Environmental QualityCNG/LNG Policy Working Group Sherrie Merrow External Relations Lead Natural Gas Economy Baton Rouge, LA |September 30, 2010
Natural Gas Economy Mission Our mission is to establish natural gas as the foundation of North America’s energy portfolio • Abundant • Affordable • Clean • Reliable • Domestic Solution 2
U.S. & Louisiana Transportation Fuel Portfolio2007 Consumption America & Louisiana rely on one primary fuel for transportation – Petroleum U.S. Gasoline Gallon Equivalents Gasoline - 140,646,000,000 Diesel - 44,533,000,000 Alternative Fuels - 414,715,000 Louisiana Gallon Equivalents Gasoline – 2,163,000,000 Diesel – 1,134,000,000 Alternative Fuels – 1,921,000 Excludes oxygenates 3 Source: Energy Information Administration (EIA)
U.S. & Louisiana Alternative Fuel Portfolio2007 Consumption America and Louisiana’s alternative fuel portfolio is dominated by natural gas products U.S. - 414,715,000 gasoline gallon equivalents (gge) Louisiana – 1,921,000 gasoline gallon equivalents (gge) Excludes Biodiesel, estimate for 2007 not available Source: EIA 4
Louisiana Alternative Portfolio2007 Vehicles & Consumption Totals 5 Data Source: EIA
Why Natural Gas Vehicles? Economical Abundant/Domestic Environmental • Incentives and grants available for vehicles, infrastructure and fuel • Significant fuel price differential as compared to gasoline or diesel • Technology today • Up to 25% Less CO2 than gasoline/diesel equivalents • Reduce Carbon Monoxide and emissions of particulates up to 90% • Abundant domestic supply of natural gas (100+ years) • 86% of consumed natural gas produced in U.S. • 98% from North America Source: Environmental Protection Agency, Naturalgas.org 6
Natural Gas Vehicle Growth by ContinentGreat North American Opportunity Natural Gas Vehicles by Continent Italy as an Example Natural Gas Vehicles (Millions) • ~600,000 NGVs • 37% growth since 2007 • NGVs have 7% market share of all new vehicles purchased • Cost of CNG is 50% to 60% less expensive than gasoline • Government incentives • Imports 89% of natural gas Fiat Qubo Natural Power 7 Source: IANGV, NGVA Europe, Fiat
Extraction / Farming Transport / Distribution Vehicle Combustion Total Life Cycle Processing Distribution Production Fuel Life Cycle EmissionsNatural Gas Provides a Cleaner Solution *Comparison of GHG emissions (gCO2e/MJ- grams of Carbon Dioxide equivalent per megajoule) using U.S. Average Generation Mix 8 Source: California Air Resources Board (California Well to Wheel Analysis), 2008
Cleaner, Healthier AirNatural Gas Emission Reductions versus Gasoline Source: EIA 9
Water Intensity of Transportation Fuels 10 Source: Deep Shale Natural Gas: Abundant, Affordable, and Surprisingly Water Efficient, Mathew Mantell, 2009
U.S. Average Retail Fuel Prices The B’s are different blends of Bio-diesel 11
Crude Oil Imports into the U.S.Opportunities for Displacement • Crude oil imports have historically led total U.S. imports of goods and services • Crude oil imports comprised nearly 15% of total imported goods in January 2010 • Net crude imports accounted for half (49.6%) of the foreign trade deficit of $37.1 billion for the month • Imports from OPEC member countries were more than twice that of the next closest country • The transportation sector presents the biggest opportunity for imported petroleum displacement Source: EIA, U.S. Census Bureau-Foreign Trade 12
CNG and Safety • Natural gas is very safe–lighter than air… dissipates when released • High ignition temperature: 1,000°-1,100°F • Gasoline ignition temperature: 495° • Diesel ignition temperature: 410° • Limited range of air/fuel combustion ratio (5-15%) • Colorless, non-toxic substance • Does not leak into groundwater • Comprehensive fuel tank, vehicle and station design/manufacturing codes & standards 13
Natural Gas for Transportation Market Segmentation CNG LNG GREEN CITIES • Municipal government fleets, light duty and medium duty vehicles • Commercial fleets and personal light and medium duty vehicles • Airport and port authorities GREEN CORRIDORS • Heavy duty vehicle freight and goods transportation • Home base and mid-point fueling patterns • Transient and varied fueling patterns GREEN GAS FACTORY • Drilling rigs and frac equipment • Service company light duty vehicle fleets • Field storage and fuel deployment solutions required GREEN COMMERCIAL • Extra heavy duty “off-road” vehicles • Rail, mining, marine, military, and construction services • Heavy duty engine solutions required 14
Natural Gas Vehicles 15 Source: Natural Gas Vehicles for America (NGVA)
USA Natural Gas Refueling InfrastructureQuick Facts • As of September 18, 2010 - 919 Total • 880 CNG stations • 39 LNG station • CNG Stations - 880 Total • 361 Public access stations (~41%) • 519 Private access stations (~59%) • LNG Stations – 39 Total • 12 Public access stations (~32%) • 26 Private access stations (~68%) 17
Regional Natural Gas Refueling InfrastructureWhere Are They? Active Stations by State Active CNG Stations 18
Regional Natural Gas Refueling InfrastructureWhere Are They? Planned Stations by State Planned CNG Stations* *Planned station include 12 month or less to become active – high confidence, longer range is being tracked, but not reported 19
U.S. Interstate Highway SystemNGV Refueling Corridors Link up regional corridors as part of expansion phase RMC ICTC I-75 TT I-75 – Interstate 75 Corridor TT – Texas Triangle RMC – Rocky Mountain Corridor ICTC – Interstate Clean Transportation Corridor 20
Natural Gas for TransportationInfrastructure Build-out • Initial build-out – create natural gas hubs to support volume required for filling stations • Municipalities/counties • Natural gas industry fleets • Local fleets • Connecting hubs to build natural gas highways • CNG refueling stations – located every 60 – 100 miles • LNG refueling stations – located every 150 – 250 miles 21 Source: Encana estimates
The Texas Triangle 200-250 miles between stations LNG and CNG (LCNG) Focus demand on heavy-duty Fleet Refuse Transit Return-to-base Long-haul Multi-phase approach TX Triangle 715 Total Miles 22
Rocky Mountain Natural Gas CorridorSample of 100 Mile Spacing Gaps 23
Utah NGV Update Current Infrastructure 26 public access 60 private access 2010 new stations Hurricane St. George Vernal DOE ARRA Project Potential for 1-3 LNG stations in UT Utility/LDC – Government Partnership Model 24
Colorado - Western Slope Update Western Slope Collaborative Support E&P company NGV conversions Engage E&P service companies to convert to NGVs Expand & connect I-70 corridor Encourage public access stations with financial and NGV volume support Education, outreach and awareness Refueling stations Rifle public access station – GEO grant, November 2010 tentative start up City of Grand Junction – private time-fill station, desires public access option with partner, late fall 2010 Parachute public access – anticipate 2011 as CNG conversions & volume builds Eagle – CME pilot, may consider public access if successful 25
Colorado – Front Range Update Weld County Plan – County Commissioner lead effort with natural gas industry Develop multi-year plan to demonstrate commitment and for funding opportunities Phase I (3-5 yrs) Develop 3-5 CNG stations Encourage >150 new NGVs Phase II (5-10 years) Expand infrastructure to 7-10 CNG stations and one LNG station NGVs to 1,000 Phase III – Program Sustainability Infrastructure to 15-25 CNG stations and 3 LNG stations NGVs to 10,000 Why Weld County Oil & Gas is major industry EPA 8-Hour non-attainment Emission & GHG reduction Regional corridor connectivity Economic development - direct and indirect jobs Petroleum displacement 26
WY Natural Gas Transportation CorridorCurrent and Proposed Infrastructure • Wyoming Working Group • Kick off meeting held June 16th • Presentation to Minerals Committee on June 28th • Producer/LDC Meeting July 28th • Jackson, Wyoming Coalition meeting – August 31, 2010 • Fleet Seminar – Jackson, Wyoming – August 31, 2010 27
Wyoming NGV Infrastructure CoalitionRegional Leadership (Producers, LDCs, Government, Organizations) Northwest Region Leadership: Y-T Clean Energy Coalition East/South Region Leadership: Anadarko, UW SER, WY State Motor Pool West Leadership: Questar, QEP Resources 28
Natural Gas Vehicle Incentive Comparisons Louisiana is a Leader 30
How do we Begin? Seriously considering transitioning to natural gas as an alternative fuel for your fleets • Analyze our fleets • Existing vehicle types (make, model, year) • Fuel use - gallons per month, miles per gallon • Refueling behavior - when and where do we fill up currently • Analyze your refueling needs • Need for time-fill or fast-fill • Need for single or multiple CNG refueling sites • Evaluate existing public infrastructure • Identify partners to participate financially and with fleet conversions to build volume to support infrastructure • Seek additional educational and training opportunities 32
Upcoming Training Natural Gas Vehicles for America (NGVAmerica) • Compelling Case Workshop with Stephe Yborra • October 14, 2010 | Bowling Green/Toledo, Ohio • November 10, 2010 | Ft. Lauderdale, FL Natural Gas Vehicle Institute • NGV Driver and Mechanic Training • October 5, 2010 | Hayward, CA • CNG Fuel Station Design Certification • November 2-3, 2010 | Downey, CA • CNG Fuel Station Operation & Maintenance Certification • November 4-5, 2010 | Downey, CA • CNG Fuel System Inspector Training • October 6-7, 2010 | Hayward, CA 33
Resources • American Natural Gas Alliance (ANGA) • http://www.anga.us/ • Alternative Fuel Stations and Prices • http://www.afdc.energy.gov/afdc/stations/advanced.php • http://www.altfuelprices.com/ • http://www.cngprices.com/ • FuelEconomy.gov • Clean Vehicle Foundation http://www.cleanvehicle.org/index.shtml • Natural Gas Vehicle Institute • http://www.ngvi.com/ • Natural Gas Vehicles for America • http://www.ngvc.org/index.html • US DOE Alternative Fuels & Advanced Vehicles Data Center • http://www.afdc.energy.gov/afdc/ • Weld County Smart Energy • http://www.weldsmartenergy.org/ • Yellowstone-Teton Clean Energy Coalition • http://www.ytcleanenergy.org/ 34