Download
1 / 1
10 likes | 137 Vues
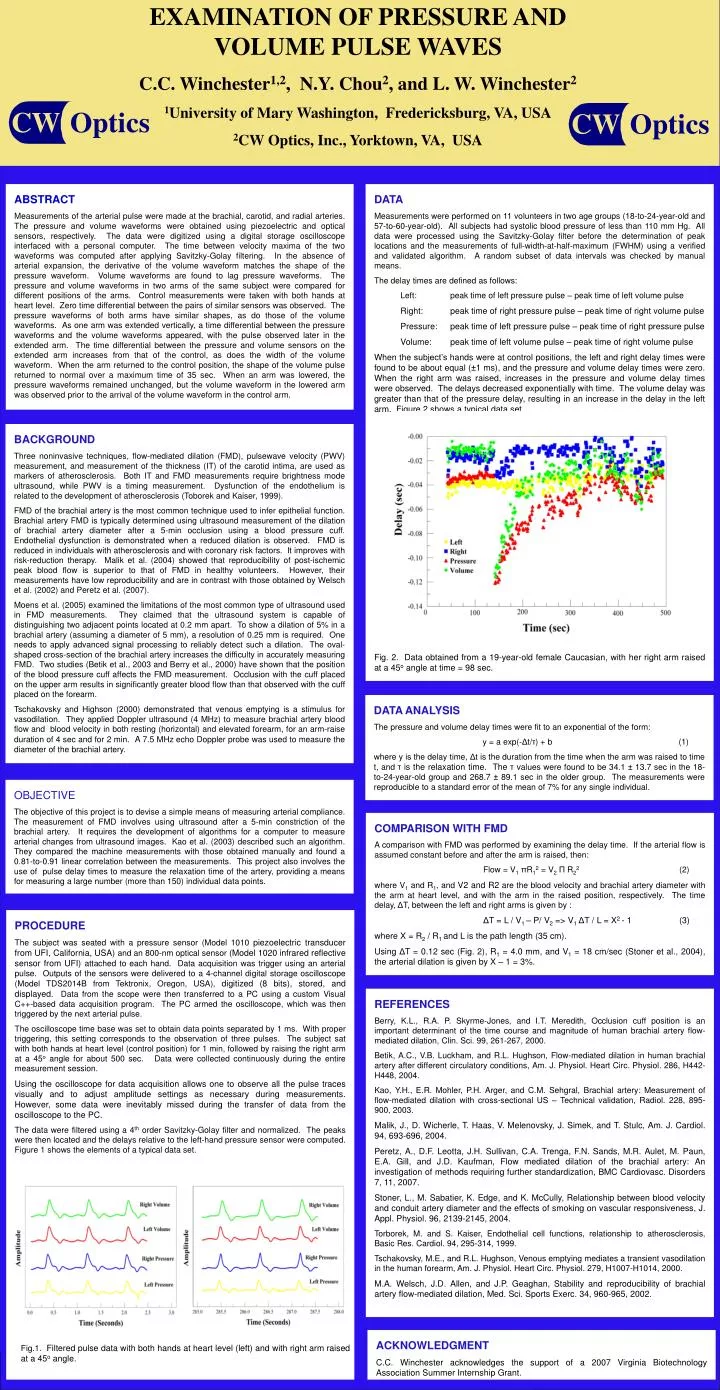
EXAMINATION OF PRESSURE AND VOLUME PULSE WAVES C.C. Winchester 1,2 , N.Y. Chou 2 , and L. W. Winchester 2 1 University of Mary Washington, Fredericksburg, VA, USA 2 CW Optics, Inc., Yorktown, VA, USA. ABSTRACT

E N D
EXAMINATION OF PRESSURE AND VOLUME PULSE WAVES C.C. Winchester1,2, N.Y. Chou2, and L. W. Winchester2 1University of Mary Washington, Fredericksburg, VA, USA 2CW Optics, Inc., Yorktown, VA, USA ABSTRACT Measurements of the arterial pulse were made at the brachial, carotid, and radial arteries. The pressure and volume waveforms were obtained using piezoelectric and optical sensors, respectively. The data were digitized using a digital storage oscilloscope interfaced with a personal computer. The time between velocity maxima of the two waveforms was computed after applying Savitzky-Golay filtering. In the absence of arterial expansion, the derivative of the volume waveform matches the shape of the pressure waveform. Volume waveforms are found to lag pressure waveforms. The pressure and volume waveforms in two arms of the same subject were compared for different positions of the arms. Control measurements were taken with both hands at heart level. Zero time differential between the pairs of similar sensors was observed. The pressure waveforms of both arms have similar shapes, as do those of the volume waveforms. As one arm was extended vertically, a time differential between the pressure waveforms and the volume waveforms appeared, with the pulse observed later in the extended arm. The time differential between the pressure and volume sensors on the extended arm increases from that of the control, as does the width of the volume waveform. When the arm returned to the control position, the shape of the volume pulse returned to normal over a maximum time of 35 sec. When an arm was lowered, the pressure waveforms remained unchanged, but the volume waveform in the lowered arm was observed prior to the arrival of the volume waveform in the control arm. DATA Measurements were performed on 11 volunteers in two age groups (18-to-24-year-old and 57-to-60-year-old). All subjects had systolic blood pressure of less than 110 mm Hg. All data were processed using the Savitzky-Golay filter before the determination of peak locations and the measurements of full-width-at-half-maximum (FWHM) using a verified and validated algorithm. A random subset of data intervals was checked by manual means. The delay times are defined as follows: Left: peak time of left pressure pulse – peak time of left volume pulse Right: peak time of right pressure pulse – peak time of right volume pulse Pressure: peak time of left pressure pulse – peak time of right pressure pulse Volume: peak time of left volume pulse – peak time of right volume pulse When the subject’s hands were at control positions, the left and right delay times were found to be about equal (±1 ms), and the pressure and volume delay times were zero. When the right arm was raised, increases in the pressure and volume delay times were observed. The delays decreased exponentially with time. The volume delay was greater than that of the pressure delay, resulting in an increase in the delay in the left arm. Figure 2 shows a typical data set. Fig. 2. Data obtained from a 19-year-old female Caucasian, with her right arm raised at a 45o angle at time = 98 sec. BACKGROUND Three noninvasive techniques, flow-mediated dilation (FMD), pulsewave velocity (PWV) measurement, and measurement of the thickness (IT) of the carotid intima, are used as markers of atherosclerosis. Both IT and FMD measurements require brightness mode ultrasound, while PWV is a timing measurement. Dysfunction of the endothelium is related to the development of atherosclerosis (Toborek and Kaiser, 1999). FMD of the brachial artery is the most common technique used to infer epithelial function. Brachial artery FMD is typically determined using ultrasound measurement of the dilation of brachial artery diameter after a 5-min occlusion using a blood pressure cuff. Endothelial dysfunction is demonstrated when a reduced dilation is observed. FMD is reduced in individuals with atherosclerosis and with coronary risk factors. It improves with risk-reduction therapy. Malik et al. (2004) showed that reproducibility of post-ischemic peak blood flow is superior to that of FMD in healthy volunteers. However, their measurements have low reproducibility and are in contrast with those obtained by Welsch et al. (2002) and Peretz et al. (2007). Moens et al. (2005)examined the limitations of the most common type ofultrasound used in FMD measurements. They claimed that the ultrasound system is capable of distinguishing two adjacent points located at 0.2 mm apart. To show a dilation of 5% in a brachial artery (assuming a diameter of 5 mm), a resolution of 0.25 mm is required. One needs to apply advanced signal processing to reliably detect such a dilation. The oval-shaped cross-section of the brachial artery increases the difficulty in accurately measuring FMD. Two studies (Betik et al., 2003 and Berry et al., 2000) have shown that the position of the blood pressure cuff affects the FMD measurement. Occlusion with the cuff placed on the upper arm results in significantly greater blood flow than that observed with the cuff placed on the forearm. Tschakovsky and Highson (2000) demonstrated that venous emptying is a stimulus for vasodilation. They applied Doppler ultrasound (4 MHz) to measure brachial artery blood flow and blood velocity in both resting (horizontal) and elevated forearm, for an arm-raise duration of 4 sec and for 2 min. A 7.5 MHz echo Doppler probe was used to measure the diameter of the brachial artery. DATA ANALYSIS The pressure and volume delay times were fit to an exponential of the form: y = a exp(-Δt/τ) + b (1) where y is the delay time, Δt is the duration from the time when the arm was raised to time t, and τ is the relaxation time. The τ values were found to be 34.1 ± 13.7 sec in the 18-to-24-year-old group and 268.7 ± 89.1 sec in the older group. The measurements were reproducible to a standard error of the mean of 7% for any single individual. OBJECTIVE The objective of this project is to devise a simple means of measuring arterial compliance. The measurement of FMD involves using ultrasound after a 5-min constriction of the brachial artery. It requires the development of algorithms for a computer to measure arterial changes from ultrasound images. Kao et al. (2003) described such an algorithm. They compared the machine measurements with those obtained manually and found a 0.81-to-0.91 linear correlation between the measurements. This project also involves the use of pulse delay times to measure the relaxation time of the artery, providing a means for measuring a large number (more than 150) individual data points. COMPARISON WITH FMD A comparison with FMD was performed by examining the delay time. If the arterial flow is assumed constant before and after the arm is raised, then: Flow = V1πR12 = V2Π R22 (2) where V1 and R1, and V2 and R2 are the blood velocity and brachial artery diameter with the arm at heart level, and with the arm in the raised position, respectively. The time delay, ΔT, between the left and right arms is given by : ΔT = L / V1 – P/ V2 => V1ΔT / L = X2 - 1 (3) where X = R2 / R1 and L is the path length (35 cm). Using ΔT = 0.12 sec (Fig. 2), R1 = 4.0 mm, and V1 = 18 cm/sec (Stoner et al., 2004), the arterial dilation is given by X – 1 = 3%. PROCEDURE The subject was seated with a pressure sensor (Model 1010 piezoelectric transducer from UFI, California, USA) and an 800-nm optical sensor (Model 1020 infrared reflective sensor from UFI) attached to each hand. Data acquisition was trigger using an arterial pulse. Outputs of the sensors were delivered to a 4-channel digital storage oscilloscope (Model TDS2014B from Tektronix, Oregon, USA), digitized (8 bits), stored, and displayed. Data from the scope were then transferred to a PC using a custom Visual C++-based data acquisition program. The PC armed the oscilloscope,which was then triggered by the next arterial pulse. The oscilloscope time base was set to obtain data points separated by 1 ms. With proper triggering, this setting corresponds to the observation of three pulses. The subject sat with both hands at heart level (control position) for 1 min, followed by raising the right arm at a 45o angle for about 500 sec. Data were collected continuously during the entire measurement session. Using the oscilloscope for data acquisition allows one to observe all the pulse traces visually and to adjust amplitude settings as necessary during measurements. However, some data were inevitably missed during the transfer of data from the oscilloscope to the PC. The data were filtered using a 4th order Savitzky-Golay filter and normalized. The peaks were then located and the delays relative to the left-hand pressure sensor were computed. Figure 1 shows the elements of a typical data set. REFERENCES Berry, K.L., R.A. P. Skyrme-Jones, and I.T. Meredith, Occlusion cuff position is an important determinant of the time course and magnitude of human brachial artery flow-mediated dilation, Clin. Sci. 99, 261-267, 2000. Betik, A.C., V.B. Luckham, and R.L. Hughson, Flow-mediated dilation in human brachial artery after different circulatory conditions, Am. J. Physiol. Heart Circ. Physiol. 286, H442-H448, 2004. Kao, Y.H., E.R. Mohler, P.H. Arger, and C.M. Sehgral, Brachial artery: Measurement of flow-mediated dilation with cross-sectional US – Technical validation, Radiol. 228, 895-900, 2003. Malik, J., D. Wicherle, T. Haas, V. Melenovsky, J. Simek, and T. Stulc, Am. J. Cardiol. 94, 693-696, 2004. Peretz, A., D.F. Leotta, J.H. Sullivan, C.A. Trenga, F.N. Sands, M.R. Aulet, M. Paun, E.A. Gill, and J.D. Kaufman, Flow mediated dilation of the brachial artery: An investigation of methods requiring further standardization, BMC Cardiovasc. Disorders 7, 11, 2007. Stoner, L., M. Sabatier, K. Edge, and K. McCully, Relationship between blood velocity and conduit artery diameter and the effects of smoking on vascular responsiveness, J. Appl. Physiol. 96, 2139-2145, 2004. Torborek, M. and S. Kaiser, Endothelial cell functions, relationship to atherosclerosis, Basic Res. Cardiol. 94, 295-314, 1999. Tschakovsky, M.E., and R.L. Hughson, Venous emptying mediates a transient vasodilation in the human forearm, Am. J. Physiol. Heart Circ. Physiol. 279, H1007-H1014, 2000. M.A. Welsch, J.D. Allen, and J.P. Geaghan, Stability and reproducibility of brachial artery flow-mediated dilation, Med. Sci. Sports Exerc. 34, 960-965, 2002. ACKNOWLEDGMENT C.C. Winchester acknowledges the support of a 2007 Virginia Biotechnology Association Summer Internship Grant. Fig.1. Filtered pulse data with both hands at heart level (left) and with right arm raised at a 45o angle.