Download
1 / 23
1k likes | 2.81k Vues
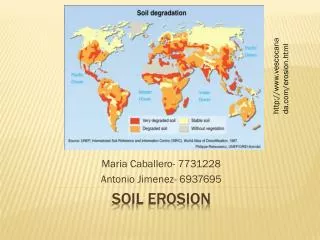
Soil Erosion. TSM 352 Land and Water Management Systems. Soil Erosion. Most important problem associated with agricultural and other land use practices. Soil Erosion. According to 1987 National Resources Inventory, USDA

E N D
Soil Erosion TSM 352 Land and Water Management Systems
Soil Erosion • Most important problem associated with agricultural and other land use practices
Soil Erosion • According to 1987 National Resources Inventory, USDA • 4 billion metric tons of soil are lost every year due to soil erosion (wind and water) in 1970s • 2 billion metric tons in 1997 due to increased used of conservation and best management practices (BMPs) • 70% of the total soil loss is from agricultural land • Economics of soil erosion: 44 billion dollars/year, $100/acre • It takes 100-600 years to form one inch topsoil • In Illinois, • 40% (9.6 million acres) cropland suffer from erosion • Average soil erosion rate: 6.18 tons in 1987. (max 50 tons/acre)
Soil Erosion by Water T - maximum average annual permissible soil loss without decreasing productivity T-values ranging from 4.5 to 11.2 metric tons/ha per year (2 to 5 tons/acre per year).
Soil Erosion • Mississippi River • The river carries roughly 550-500 million tons of sediment into the Gulf of Mexico each year. • It brings enough sediment to extend the coast of Louisiana by 91 m (300 ft) each year.
Soil Transport • Mechanism • Micro-scale soil transport: Surface erosion • Macro-scale soil transport: Mass movements (Landslides) • Erosion is the detachment and transport of soil particles (natural and accelerated) • Sediment is relocated from the source (= soil) to streams and eventually into reservoirs or the sea • Sedimentation: deposition of sediments in streams or on fans and floodplains
Effects of Soil Erosion • On site • Loss of top fertile soil • Loss of nutrients, OM • Decreased productivity • Off site • Non-point source pollution • Filling of reservoirs and dams • Air quality problem • Effects on aquatic organisms • Effects on drinking water quality • Redistribution of pollutants and toxics
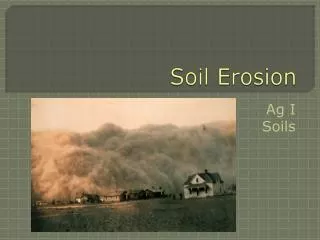
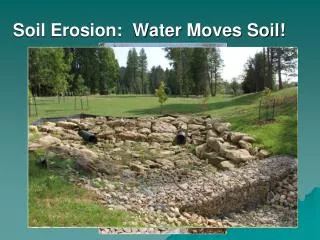
Soil Erosion Erosion is caused by: • Water • Primary water erosion (Splash Erosion) • Secondary water erosion (Surface flow induced erosion) • Wind erosion • The Dust Bowl of 1930s (1934 -1936) in the Great Plains • Frost erosion • Particularly effective in mountainous areas • Example: NW USA
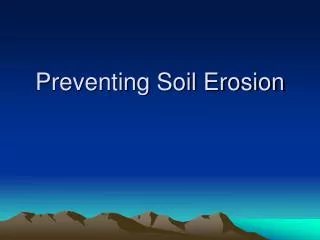
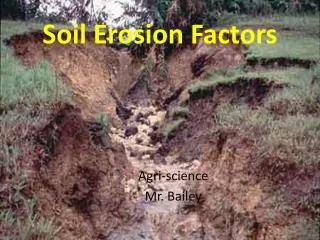
Factors Affecting Soil Erosion • Climate • Soil • Topography – slope length and steepness • Vegetation • Land-use practices
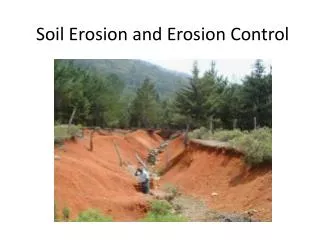
Water Erosion Processes • Raindrop/splash Erosion • Sheet Erosion • Rill Erosion • Gully Erosion • Stream channel Erosion • Shore line Erosion Interrill Erosion
Water Erosion processes - Hillslope View Hillel, 1998
Splash Erosion - Raindrop Impact • Erosive power = Skinetic energy (EK = mv2/2) and momentum (M = mv) • Fog ~ 0.05 mm/h • Light rain ~ 1.02 mm/h • Heavy rain ~ 15.24 mm/h • Torrential rain ~ 101.60 mm/h Brook et al, Fig 7.2 Notes:- Soil aggregates destroyed- Saltation- Erosivity threshold ~25 mm/h Hillel, 1998; Selby, 1993 P. Gary White
Surface flow induced erosion • Requires overland flow (thin surface films or concentrated) and often is intensified by raindrop impact • The generation of surface flow depends on: • Rain intensity • Water content of the soil • Density of the soil • Surface roughness of the soil • SCS CN method: “Water moves through a watershed as sheet flow, shallow concentrated flow, open channel flow, or some combination of these…After a maximum of 300 feet, sheet flow usually becomes shallow concentrated flow” • Important in range and agricultural systems
Overland flow Rill Sheetflow Gully • Exceeds detention storage • Begins with detachment: requires a force (shear) created by small eddies in flow or raindrop impact t0 = f (density, water depth, slope)
Rill and Gully Formation Brooks et al., Fig 8.1
Interrill Erosion Di = Kii q SfCv (Equation 7.1) Di = Interrill erosion rate (kg/m2-s) Ki = Interrillerodibility of soil (kg-s/m4) (Table 7.1) i = Intensity of rainfall (m/s) q = Runoff rate (m/s) Sf = Interrill slope factor = 1.05 – 0.85 e(-4sinθ) where θ = slope angle (degree) Cv = Cover adjustment factor (0 - 1)
Rill Erosion Rate (Equation 7.2) Dr = Rill detachment rate (Kg/m2-s) Kr = Rill erodibility, due to shear (s/m) = Hydraulic shear of flowing water (Pa) = γ R S (Equation 7.3) γ = Specific weight of water (9810 N/m3) R = Hydraulic radius of rill (m) S = Hydraulic gradient or slope (m/m) c = Critical shear below which no erosion occur (Pa) qs = Rate of sediment flow in rill (Kg/m-s) Tc = Sediment transport capacity of rill (Kg/m-s) = B 1.5 (Equation 7.4) B = Transport coefficient based on soil and water properties generally between 0.01 and 0.1 (dimensionless)
Rill Erosion Rate • If Tc > qs : erosion takes place • If Tc< qs: deposition takes place • If > c : erosion takes place • If < c : no erosion : defines erosion or deposition The interrill and rill erosion processes are used in several process-based erosion prediction computer models, including the Water Erosion Prediction Project (WEPP) model
Example: Rill Erosion A rill channel is observed at a location 20 m from the top of the hill during a storm. The slope is 5%, the rill width is 150 mm, and the hydraulic radius is estimated to be 0.01 m, respectively. The sediment transport rate (qs) is measured and found to be 0.2 kg/m-s. The rill erodibility (Kr) is estimated to be 0.004 s/m, critical shear (c) to be 2.5 Pa, and transport coefficient (B) to be 0.1. Assume that the specific weight of water is 9810 N/m3. Calculate the sediment transport capacity and erosion rate for the location. If the hillslope is 120 m long and rainfall duration is 1 hour, how much soil will be eroded from the hillslope by rill erosion? • = γ R S (Pa) • Tc= B 1.5 (Kg/m-s) • (Kg/m2-s) = 4.905 Pa Tc= 1.086 Kg/m-s Dr= 0.00785 Kg/m2-s = 0.1629 Kg/s = 0.001177 Kg/m-s = 423.8 Kg
Wind erosion • Important especially in arid regions • Dependent on • Wind speed and exposure • Soil particle- and aggregate sizes • Surface roughness • Tillage • Surface roughness creates turbulence in the surface-near air layer → Under pressure sucks particles in the air • Form of movement: < 0.1 mm → Suspension (“dust storm”) < 1 mm → Saltation (“jumping”) > 1mm → Creep (“rolling”)