Download
1 / 84
840 likes | 1.01k Vues
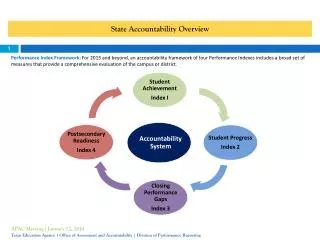
2004 State Accountability System Overview. Texas Education Agency Performance Reporting Division (512) 463-9704 and perfrept@tea.state.tx.us May 10, 2004. Overall Design. The overall design of the state accountability system is an improvement model

E N D
2004 State Accountability System Overview Texas Education Agency Performance Reporting Division (512) 463-9704 and perfrept@tea.state.tx.us May 10, 2004
Overall Design • The overall design of the state accountability system is an improvement model • Campuses and districts must meet either an absolute standard or an improvement standard for each accountability measure at the Academically Acceptable level 2004 State Accountability System
Rating Labels Campuses and districts are assigned the same rating labels: • Exemplary • Recognized • Academically Acceptable • Academically Unacceptable 2004 State Accountability System
State Accountability Indicators • Texas Assessment of Knowledge and Skills (TAKS) Reading/English Language Arts (ELA) • TAKS Writing • TAKS Mathematics • TAKS Social Studies • TAKS Science • State-Developed Alternative Assessment (SDAA) • Completion Rate (grades 9-12) • Annual Dropout Rate (grades 7-8) 2004 State Accountability System
Additional Requirements for Exemplary & Recognized Districts: • cannot have any campuses rated Academically Unacceptable • must meet underreported students standards (cannot have more than 500 or greater than 5% underreported students) 2004 State Accountability System
Alternative Education Campuses • In 2004 only, campuses registered for alternative education accountability (AEA) procedures will receive a rating of Alternative Education • Performance of AEA campuses is included in the district rating in 2004 2004 State Accountability System
Charters • Charters will be rated under district rating criteria based on aggregated campus performance • Charter campuses will be rated under campus rating criteria 2004 State Accountability System
TAKS Indicator The TAKS performance indicators are calculated as % Met Standard using the student passing standard adopted by the State Board of Education (SBOE) for each specific year - for 2004: • 1 SEM for grades 3-10 • 2 SEM for grade 11 2004 State Accountability System
TAKS Accountability Subsets • District mobility: District ratings are based on test results for students enrolled in the district on the PEIMS fall “as of” date • Campus mobility: Campus ratings are based on test results for students enrolled on the campus on the PEIMS fall “as of” date 2004 State Accountability System
TAKS Accountability Subsets (cont) For grade 3 Reading: • results for students who change campuses between the 1st and 2nd administrations of the test are not included in the accountability subset for either campus (also applies at the district level) • both passing and failing results are removed from the accountability subset 2004 State Accountability System
TAKS Subjects and Grades • Reading, grades 3-9; ELA, grades 10-11 (combined/evaluated as a single subject) • Writing, grades 4 and 7 • Mathematics, grades 3-11 • Social Studies, grades 8, 10-11 • Science, grades 5, 10-11 2004 State Accountability System
TAKS Student Groups TAKS performance is evaluated forAll Students and for the following student groups meeting minimum size requirements: • African American • Hispanic • White • Economically Disadvantaged 2004 State Accountability System
TAKS Minimum Size forStudent Groups • 30/10%/50 • Student groups are evaluated if the campus or district has test results for at least 30 students in the group (summed across grades) for the subject and that represents at least 10% of all tests takers in that subject, or test results for at least 50 students in the group even if that represents less than 10% of all test takers in that subject 2004 State Accountability System
TAKS Small Numbers • TAKSperformance is always evaluated for All Students • Campuses and districts with less than 30 total students tested on TAKS receive special analysis to determine if the initial rating assigned is an aberration or an indication of consistent performance 2004 State Accountability System
No Students in Grades Tested Districts are required to pair campuses with no students enrolled in grades tested on TAKS (grades 3-11): • pair with another campus with a feeder relationship • pair with the district when the campus has a feeder relationship with many campuses or when the campus serves students from across the district in a special program 2004 State Accountability System
TAKS Standard: Exemplary • The TAKS standard for all subjects for an Exemplary campus and district rating is set at 90% beginning in 2004 2004 State Accountability System
TAKS Standard: Recognized • The TAKS standard for all subjects for a Recognized campus and district rating is set at: • 70% in 2004 through 2006 • 75% in 2007 • 80% in 2008 (where it is expected to remain) 2004 State Accountability System
TAKS Standards:Academically Acceptable 2004 through 2006: • Reading/ELA, Writing, Social Studies: 50% • Mathematics: 35% • Science: 25% In 2007, the standards will begin to increase incrementally until they reach 70% 2004 State Accountability System
TAKS Required Improvement (RI) • Campuses and districts not meeting the absolute standard for any TAKS subject (All Students or any student group) can meet the accountability criteria for that measure by demonstrating RI 2004 State Accountability System
TAKS RI (cont) RI applies to campuses and districts not meeting the absolute performance standard for: • Academically Acceptable • Recognized Campuses and districts must have at least 65% MetStandard in 2004 to be eligible for the RI option at the Recognized level 2004 State Accountability System
TAKS RI Standard • For 2004 only, the RI standard is amount of gain in % Met Standard required to reach the accountability standard in 2 years 2004 State Accountability System
TAKS RI Calculation • Amount of gain in % Met Standard at the current year passing standard - prior year results are recalculated at the current year student passing standard, 1 SEM to 1 SEM 2004 State Accountability System
TAKS RI Minimum Size • TAKS RI will be calculated for any subject and student group the meets minimum size requirements in 2004 and has test results for at least 10 students in 2003 2004 State Accountability System
SDAA Indicator • Average SDAA performance • Calculated as the number of tests meeting admission, review, and dismissal (ARD) committee expectations (summed across grades and subjects) divided by the number of SDAA tests for which ARD expectations were established (summed across grades and subjects) 2004 State Accountability System
SDAA Subjects and Grades • Reading, grades 3-8 • Writing, grades 4 and 7 • Mathematics, grades 3-8 2004 State Accountability System
SDAA Accountability Subsetsand Student Groups • District and campus mobility is applied • SDAA performance is evaluated forAll Students only 2004 State Accountability System
SDAA Minimum Size • SDAA All Students performance will be evaluated for campuses and districts with results from 30 or more tests (summed across grades and subjects) • The minimum size requirement of 30 tests can represent as few as 10 students. 2004 State Accountability System
2004 SDAA Standards • Exemplary: 90% • Recognized: 70% • Academically Acceptable: 50% 2004 State Accountability System
SDAA Required Improvement (RI) • Campuses and districts not meeting the absolute standard for SDAA can meet the accountability criteria for the SDAA measure by demonstrating RI 2004 State Accountability System
SDAA RI (cont) RI applies to campuses and districts not meeting the absolute performance standard for: • Academically Acceptable • Recognized Campuses and districts must have at least 65% Met ARD Expectations to be eligible for the RI option at the Recognized level 2004 State Accountability System
SDAA RI Standard • For 2004 only, the RI standard is amount of gain from 2003 in % Met ARD Expectations required to reach the accountability standard in 2 years 2004 State Accountability System
SDAA RI Minimum Size • SDAA RI will be calculated for any campus and district with at least 30 SDAA test results in 2004 and at least 10 SDAA test results in 2003 2004 State Accountability System
SDAA in 2005 • In 2005, SDAA II will be administered statewide for the first time. The SDAA accountability measure will be updated. 2004 State Accountability System
Adopting theNCES Dropout Definition • State statute requires Texas to adopt the NCES dropout definition for 2005-06 leavers • Students leaving school to enter an alternative program to work toward a HS diploma or GED certificate are dropouts under the NCES definition 2004 State Accountability System
Using theNCES Dropout Definition • The NCES definition will be used in the 2005-06 annual dropout rate calculation (2007 ratings) • The NCES definition will be used in the completion rate calculation for the class of 2009 when 4 years of data are available (2010 ratings) 2004 State Accountability System
Completion Rate Indicator • For 2004 and 2005, a high school completer is a student who graduates, receives a GED certificate, or returns to school for a fifth year (continuing student) • The completion rate is high school completers as a percent of total students in the class (graduates + GED recipients + continuing students + dropouts) 2004 State Accountability System
Completion Rate Grades • All campuses and districts that have served grades 9-12 for the last 5 years will be evaluated on completion rate • Campuses that include any of the grades 9-12 but do not have a completion rate (have not served grades 9-12 for the last 5 years) are assigned the completion rate of the district 2004 State Accountability System
Completion Rate Student Groups If minimum size requirements are met, then completion rates are evaluated for: • All Students • African American • Hispanic • White • Economically Disadvantaged 2004 State Accountability System
Completion RateMinimum Size for All Students • For 2004 only, completion rates are evaluated at the All Students level if there are at least 10 students in the class and at least 10 dropouts (non-completers) 2004 State Accountability System
Completion RateMinimum Size for Student Groups • For 2004 only, at least 10 dropouts (non-completers) and 30/10%/50 • At least 30 students in the group and the group represents at least 10% of students in the class or at least 50 students in the group even if that represents less than 10% of all students in the class 2004 State Accountability System
Completion Rate Standards 2004 through 2006: • Exemplary: 95% • Recognized: 85% • Academically Acceptable: 75% The Recognized standard is expected to increase to 90% and Academically Acceptable to 85% 2004 State Accountability System
Completion RateRequired Improvement (RI) • Campuses and districts not meeting the Academically Acceptable absolute standard for completion rate (All Students or any student group) can meet the accountability criteria for that measure by demonstrating RI • Development of a completion rate RI standard for the Recognized level will be considered for 2005 2004 State Accountability System
Completion Rate RI Standard:Academically Acceptable • For 2004 only, the RI standard is amount of gain from the prior year required to meet a 75% completion rate in 2 years 2004 State Accountability System
Completion Rate RI Minimum Size • Completion rate RI will be calculated for All Students and any student group that meets minimum size requirements for completion rate in 2004 and has at least 10 students in the completion rate class in 2003 2004 State Accountability System
Annual Dropout Rate Indicator • The annual dropout rate is grade 7 and 8 dropouts as a percent of total students in attendance at any time in grades 7 and 8 in a single school year 2004 State Accountability System