Download
1 / 16
160 likes | 178 Vues
Delve into the fascinating world of solar cycles, sunspots, and relativity theories with this detailed guide covering Maunder Minimum, Lorentz Factor, Einstein's insights, Special Relativity, and possibilities for space travel. Understand the concepts of Solar Maximum and Minimum, differential rotation of the Sun, and stellar atmospheres. Explore the Lorentz Factor, Einstein's groundbreaking theories, and the implications of Special Relativity. Discover how time dilation and length contraction vary based on the observer's frame of reference. Unravel the mysteries of space travel, including the impact on time perception and the feasibility of interstellar journeys. Learn about Wien's Law, Annie Jump Cannon's spectral classification system, and the nuances of measuring stellar temperatures. Enhance your knowledge of astronomy and astrophysics with this in-depth exploration of celestial phenomena and theoretical frameworks.

E N D
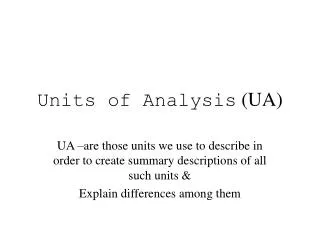
The number of sunspots seen increases and decreases periodically. Every 11 years or so, the sunspot number peaks. This is called Solar Maximum Around 5.5 years after Solar Maximum, the sunspot number is at its lowest level. This is called Solar Minimum Solar activity (CMEs, flares, etc.) peaks with the sunspot number The Solar Cycle
Differential Rotation • Different parts of the sun rotate at different speeds • Equator rotates faster than the poles • Solar magnetic fields get twisted as time goes on
The Maunder Minimum • Very few sunspots were recorded between 1645 and 1725 • This is called the Maunder Minimum • Corresponds to relatively lower temperatures here on Earth, a “little ice age” • The reason for the Maunder Minimum and its effect on climate are still unknown
This does not work for Light! • If Galilean Relativity worked for light, we would expect to see light from a star in orbit around another star to arrive at different times, depending on the velocity of the star. • We do not see this – light always travels at the same speed.
The Michelson-Morley Experiment • Two scientists devised an experiment to detect the motion of the Earth through the “aether” • Light should move slower in the direction of the Earth’s motion through space • Detected no difference in speed! • No aether, and the speed of light seemed to be a constant!
The Lorentz Factor • It was proposed that perhaps matter contracted while it was moving, reducing its length in the direction of motion • The amount of contraction was described by the Lorentz factor • At slow speeds, the effect is very small • At speeds close to the speed of light, the effect would be very pronounced!
Einstein’s Insights • Albert Einstein started from the assumption that the speed of light was a constant, and worked out the consequences • Length does indeed contract in the direction of motion, by a fraction equal to the Lorentz factor • Time stretches as well, also by the Lorentz factor • Moving clocks run slow • Moving objects reduce their length in the direction of motion
Special Relativity • Time dilation and length contraction depend on the observer! • To an observer on Earth, the spacecraft’s clock appears to run slow, and the ship looks shorter • To an observer on the ship, the Earth appears to be moving in slow-motion, and its shape is distorted. • The passage of time and space are relative!
Possibilities for Space Travel • Example: A spacecraft leaves Earth, heading for a star 70 light-years away, traveling at .99c • To an observer on Earth, it takes the spacecraft 140 years to get to the star, and back again • To passengers on the ship, it only takes 20 years for the round-trip! • This means that high speed travel to the stars is possible, but comes at the cost of friends and family…
You see this every day! • More distant streetlights appear dimmer than ones closer to us. • It works the same with stars! • If we know the total energy output of a star (luminosity), and we can count the number of photons we receive from that star (brightness), we can calculate its distance • Some types of stars have a known luminosity, and we can use this standard candle to calculate the distance to the neighborhoods these stars live in.
Photons in Stellar Atmospheres • Photons have a difficult time moving through a star’s atmosphere • If the photon has the right energy, it will be absorbed by an atom and raise an electron to a higher energy level • Creates absorption spectra, a unique “fingerprint” for the star’s composition. The strength of this spectra is determined by the star’s temperature.
Stellar Surface Temperatures • Remember from Unit 23 that the peak wavelength emitted by stars shifts with the star’s surface temperatures • Hotter stars look blue • Cooler stars look red • We can use the star’s color to estimate its surface temperature • If a star emits most strongly in a wavelength (in nm), then its surface temperature (T) is: • This is Wien’s Law
Around 1901, Annie Jump Cannon developed the spectral classification system Arranges star classifications by temperature Hotter stars are O type Cooler stars are M type New Types: L and T Cooler than M From hottest to coldest, they are O-B-A-F-G-K-M Mnemonics: “Oh, Be A Fine Girl/Guy, Kiss Me Or: Only Bad Astronomers Forget Generally Known Mnemonics Spectral Classification