JAMBU Island
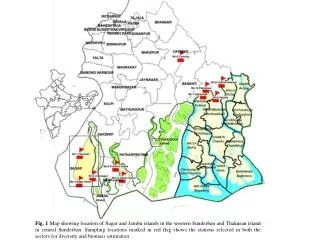
THAKURAN Island. JAMBU Island. Fig. 1 Map showing location of Sagar and Jambu islands in the western Sunderban and Thakuran island in central Sunderban. Sampling locations marked in red flag shows the stations selected in both the sectors for diversity and biomass estimation. 1924. 1955.

JAMBU Island
E N D
Presentation Transcript
THAKURAN Island JAMBU Island Fig. 1 Map showing location of Sagar and Jambu islands in the western Sunderban and Thakuran island in central Sunderban. Sampling locations marked in red flag shows the stations selected in both the sectors for diversity and biomass estimation
1924 1955 1975 1989 1999 Fig. 2a Shoreline changes in Sagar Island during 1924-2008
A A A B B 1955 1975 1989 B A A A A B B B B 2 Fig. 2b Shoreline changes in Jambu Island during 1924-2008
1924 1955 1989 1975 2002 2005 1999 2008 Fig. 2c Shoreline changes in Thakuran island during 1924-2008
Fig. 3a Temporal variation of fish and phytoplankton diversity index (H) in the western and central sectors of Indian Sunderbans Fig. 3b Temporal variation of phytoplankton standing stock (N) in the western and central sectors of Indian Sunderbans
(a) (b) (c) Fig. 4 Seasonal variation of AGB of (a) Sonneratia apetala, (b) Avicennia alba and (c) Excoecaria agallocha in the selected stations during 2009-2010; x-axis depicts the number of stations and y-axis the ABG value up to 70 t/ha