Download
1 / 45
450 likes | 469 Vues
The Advanced Satellite Products Branch (ASPB) at STAR develops cutting-edge environmental satellite products for short-term weather forecasting and earth-atmosphere monitoring. Research includes algorithms for cloud properties, temperature, moisture profiles, and more. Collaborating with CIMSS, ASPB's focus ranges from GOES products to climate and weather modeling. Explore ASPB's achievements in weather prediction and satellite data assimilation on their website.

E N D
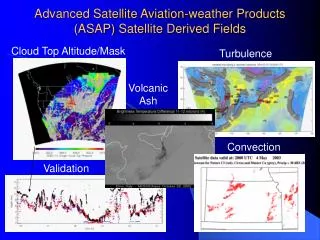
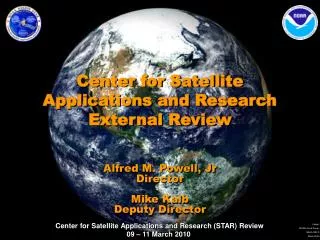
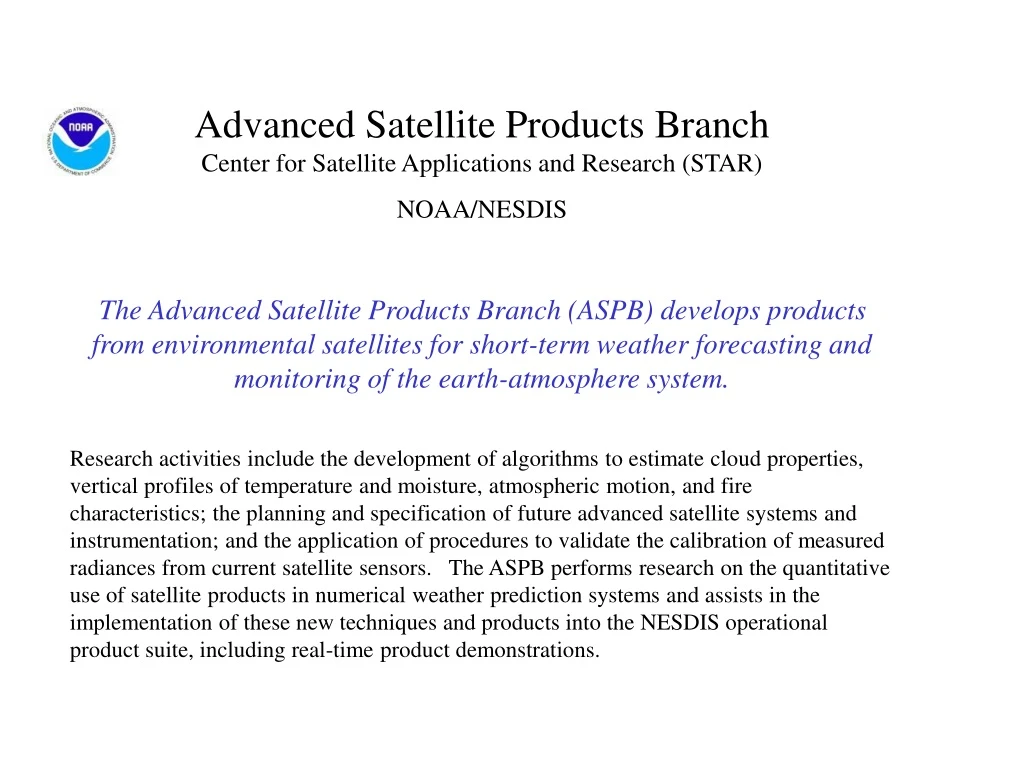
Advanced Satellite Products BranchCenter for Satellite Applications and Research (STAR) NOAA/NESDIS The Advanced Satellite Products Branch (ASPB) develops products from environmental satellites for short-term weather forecasting and monitoring of the earth-atmosphere system. Research activities include the development of algorithms to estimate cloud properties, vertical profiles of temperature and moisture, atmospheric motion, and fire characteristics; the planning and specification of future advanced satellite systems and instrumentation; and the application of procedures to validate the calibration of measured radiances from current satellite sensors. The ASPB performs research on the quantitative use of satellite products in numerical weather prediction systems and assists in the implementation of these new techniques and products into the NESDIS operational product suite, including real-time product demonstrations.
ASPB: Location Collocated with the Cooperative Institute for Meteorological Satellite Studies (CIMSS) at the University of Wisconsin-Madison. CIMSS is part of the UW Space Science and Engineering Center (SSEC). Also in the building is the Department of Atmospheric and Oceanic Sciences (AOS).
ASPB: People Bob Aune: satellite data assimilation; modeling. Andy Heidinger: remote sensing of clouds; radiative transfer. Jeff Key (Branch Cheif): remote sensing of cloud and surface properties at high latitudes. Tim Schmit: GOES-R, GOES calibration, temperature and moisture profile, clouds. Gary S. Wade: real-time GOES processing, Derived Product Images. Incoming (30 Apr) - Brad Pierce: air quality modeling and data assimilation
ASPB - CIMSS Synergy The cooperative institute arrangement provides NOAA with a rich, stable, and flexible research environment to help fulfill the NOAA mission for the benefit of the public. NOAA scientists collaborate extensively with CIMSS scientists on basic research as well as experimental product development. The arrangement is flexible in that the number of CIMSS scientists can be adjusted to accommodate changes in federal funding levels, which is far easier than changing the size of the federal workforce. The university environment is conducive to outreach activities. For example, graduate and undergraduate students are involved in NOAA-funded research, NOAA personnel frequently give lectures in university courses and academic department seminars, and results from research projects are often used in the classroom.
ASPB Research Priorities • Weather (NOAA strategic goal: Weather and Water) • GOES products: soundings, winds, fires, clouds, clear-sky Tb • POES products: polar winds, global clouds, snow/ice • Satellite data assimilation and weather forecasting • Air quality modeling and data assimilation (new!) • Climate (NOAA goal: Understanding climate variability and change) • Global cloud cover • Polar clouds and surface properties; interactions • Biomass burning • Instruments (NOAA goals: weather, climate, commerce, ecosystems, supporting NOAA mission; i.e., all goals) • Calibration • Intercalibration • Future instruments: • GOES-R • NPOESS
ASPB Funding Sources • Research Activities in Support of Geostationary and Polar Orbiting Weather Satellite Science Topics - biomass burning, geo and polar winds, intercalibration, sounding retrieval products, clouds, clear sky Tb • Ground Systems development (preparation for new sensors, hardware; global geo fire monitoring; AWIPS development) • GOES-R Algorithm Working Group (AWG) - clouds, aviation, soundings, cryosphere, proxy data • Study of the ABS Hyperspectral Environmental Suite Data Compression • Studies on Next Generation GOES Sounder (HES) and Imager (ABI) on GOES-R and beyond • GIMPAP - sounding retrieval methods, validation, winds, cloud height, surface emissivity, aerosols, ozone, SST • Polar winds: PSDI and NASA • NPOESS IGS: VIIRS cloud, snow/ice, and calibration studies • Climate: NSF and NOAA projects for Arctic lateral heat and moisture advection, polar satellite climatology, Arctic land surface fluxes
ASPT on the Web http://stratus.ssec.wisc.edu/aspb/ http://cimss.ssec.wisc.edu/aspb
Bob Aune Satellite data assimilation; modeling.
CIMSS Regional Assimilation System CRAS Purpose To assess the impact of space-based observations on numerical weather prediction First real time prediction system to use cloud and moisture products from the GOES sounders (1995)
48 hour accumulated precipitation from the 61 km CIMSS Regional Assimilation System (CRAS) forecast valid 12 UTC, September 14, 2003. 48 hour accumulated precipitation from the National Weather Service 12km operational Eta model forecast valid 12 UTC, September 14, 2003.
Products available from the four CRAS real-time production runs. 61 km CONUS 40 km NE PAC 40 km NE PAC CRAS forecast imagery CRAS precipitation forecast 48 km Antarctica CRAS 12-hr forecast radar 20 km Cent US Observed radar
Hourly water vapor and cloud observations from the GOES-12 sounder are used to initialize 36-hr CRAS forecasts for central U.S. Time series plots are generated for instrumented sites used by the Road Weather Information System (RWIS) maintained by WisDOT. 30 hour surface relative humidity forecast from the CIMSS Regional Assimilation System (CRAS) valid 18UTC, Dec 6, 2003 36 hour forecast time series of temperature, dew point, wind, precipitation and cloud cover from the CIMSS Regional Assimilation System (CRAS) initialized at 12UTC Dec 5, 2003. Surface stations reporting fog at 15UTC, Dec 6, 2003 Road Weather Information System (RWIS) tower locations maintained by WisDOT
3-hour nowcast of GOES-12 level 2 (.9σ-.7σ) PW valid 18UTC 04Nov03 Upper left is corresponding GOES sounder image. Observation fit is shown at right
Andy Heidinger Remote sensing of clouds; radiative transfer.
Example of CLAVR-x products available in real-time The suite of CLAVR-x includes a full range of cloud products in addition to the standard cloud mask. Cloud Top Temperature Cloud Mask + Surface Temp.
Pixel Level SST (SST – This is what is used by RAL for POES/GOES SST) (All of this information is available in the SST file and this analysis can be done automatically) Unmasked pixel level SST Histogram of SST – background SST Cloud Masked SST background SST field
Real-time orbital Example of the type of gridded information produced by CLAVR-x. All are made available through OSDPD/ORA. Single Satellite Daily Asc/Des fields Multi-satellite Synoptic Fields
Idealized cross section of a hurricane showing expected areas of multi-layer cloud (taken from NOAA) Example Pixel Level Result of the Cloud Typing with Multi-layer Detection using the AVHRR Algorithm: Typhoon Inoue in Indian Ocean observed from MODIS
Initial Results from PATMOS-x: Our time series of cloud amount seems stable compared to that from ISCCP. The downward trend seen in ISCCP is contentious – we do not see that trend and are one of a few projects that produce an independent global cloud climatology.
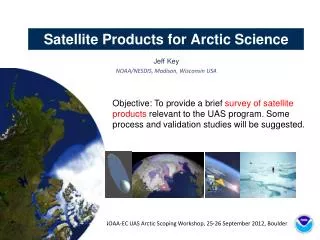
Jeff Key Remote sensing of cloud and surface properties at high latitudes.
MODIS winds are generated and made available in real-time for each 200 minute triplet. AVHRR GAC winds are also generated in near real-time. Both are available at http://stratus.ssec.wisc.edu/products/rtpolarwinds. Polar Winds MODIS Model impact studies have shown that the polar winds have a positive impact on weather forecasts not just in the polar regions, but globally. Hurricane track forecasts are also improved!
Direct Broadcast Polar Winds • Direct broadcast (DB) MODIS winds and other products are now being generated at McMurdo, Antarctica, Tromsø, Norway, and Sodankylä, Finland. • Other products include cloud properties (mask, phase, pressure), TPW, low-level temperature inversion characteristics, surface temperature and albedo, snow and vegetation indices. More to come! http://stratus.ssec.wisc.edu/db
Retrieval of Surface, Cloud, and Radiation Properties in the Polar Regions from the AVHRR The goal of this project is estimate surface temperature, albedo, cloud amount, height, thickness, and phase, and surface radiation fluxes in the polar regions with the Advanced Very High Resolution Radiometer (AVHRR), to assess their role in the surface energy budget, and to examine trends over the last two decades. A 20-year satellite cloud climatology over the Arctic and Antarctic continent has been developed. Major Finding: Changes in cloud amount, decreasing in winter and increasing in spring and summer, seem to be damping the rise in surface temperature; i.e., climate feedbacks may be slowing Arctic warming. Above: Winter trend in cloud fraction over the Arctic (Greenland at bottom left) based on the 1982-2000 AVHRR Polar Pathfinder extended (APP-x) product. Right: Seasonal and annual trends in surface temperature and surface albedo over the Arctic.
Mike Pavolonis Remote sensing of clouds and volcanic ash
IR image Ash product Improving Volcanic Cloud Warnings From the 1544 UTC VAAC message: “REMARKS: WE HAVE RECEIVED A REPORT FROM NAVY AVIATION IN THE AREA INDICATING AN ERUPTION OF SANTA ANA TO FL460. THE ERUPTION CANNOT BE SEEN IN THE 1515Z IMAGE POSSBILY BECAUSE OF WEATHER CLOUDS IN THE AREA. MODEL DATA SUGGESTS ANY ASH NEAR FL460 WILL MOVE TOWARD THE WEST” From the 1601 UTC VAAC message: “REMARKS: THE ERUPTION IS NOW BELIEVED TO HAVE STARTED AT ABOUT 1400Z AND AN AREA PREVIOUSLY THOUGHT TO BE THUNDERSTORMS IS NOW IDENTIFIED AS THICK ASH. A FORECAST WILL BE ISSUED AS SOON AS POSSIBLE” The automated Pavolonis et al. technique (JTECH) would have identified the Santa Ana ash cloud in the 1445 UTC image (one of the first images capturing the eruption). This product would have likely helped the Washington Volcanic Ash Advisory Center (VAAC) issue a more timely warning statement.
High/mid cloud Tropopause Isotherms Aerosol layer Low cloud Surface Elevation and Type GOES-R Algorithm Validation When co-located with SEVIRI, CALIPSO can serve as a validation source for GOES-R algorithms
Tim Schmit GOES-R, GOES calibration, temperature and moisture profile, and clouds.
GOES-8 Summary web page generated by working with an undergraduate. Task came from deputy AA level. http://cimss.ssec.wisc.edu/goes/goes8/
Heater turned off Heater turned on Calibration mode switch Cloud- Top Pressure: 20 February 21 February 22 February 23 February Monitored GOES Imager calibration changes and affects on products.
GOES-12 Imager, Cloud-Top Pressure – now an Operational product!
Simulated GOES-R ABI Image Difference TOMS Carn USING GOES-R TO HELP MONITOR UPPER LEVEL SO2 Anthony J. Schreiner*, Timothy J. Schmit#, Jun Li*, Gary P. Ellrod#, Mat Gunshor* *CIMSS #NOAA/NESDIS Simulated IR spectrums for “normal” and “SO2 enriched” atmosphere and spectral response functions Plume Differenceand GOES-R ABI SRF Plume GOES Sounder Image Difference Differenceand the GOES Sounder SRF
“0.47m” “0.64m” “0.86m” “1.38m” “1.61m” “2.26m” “3.9m” “6.19m” “6.95m” “7.34m” “8.5m” “9.61m” “10.35m” “11.2m” “12.3m” “13.3m” Using MODIS, MET-8 and AIRS to simulate the spectral bands on the Advanced Baseline Imager (ABI)
Gary Wade Real-time GOES processing, Derived Product Images.
A hallmark of GOES processing at CIMSS is its continual “real-time” displays, day in and day out Continuity and content of Sounder imagery = qualitative cornerstone of continuing hope for determining better atmospheric profiles GOES-12 replaces GOES-8 = seamless transition New satellite coverage = new display New Imager band = new capability
Differentiation of the three vertical layers of precipitable water from the GOES Sounders 16 UT 15 Dec 2003 Total PW High layer PW Mid layer PW Low layer PW Note how ovals of relative maximum PW, over US, shift with height. [See - http://cimss.ssec.wisc.edu/goes/realtime/grtmain.html#uspw-3l ]
Example of real-time GOES Sounder Derived Product Imagery Focused on Wisconsin GOES total precipitable water (TPW) DPI at 1700 UTC on 25 Aug 2003 GOES (<40mm) evidently drier than first-guess GOES (40-50mm+) markedly moister than first-guess (Shouldn’t such differences impact forecasts ?)
Fundamental CIMSS research: striving to make quality real-time GOES Sounder radiance observations into practical useful information for weather forecasting Atmospheric continuity and evolution are clearly evident in multi-spectral animation. Where will clouds be? Comparison between observed imagery (bottom) and forecast imagery (top) builds confidence in how well the CRAS model is assimilating retrieved GOES Sounder cloud and moisture information. Where will forecast (GFS) moisture need to be modified, monitoring trends, to provide a better forecast for convection (as across Texas)? Differences between retrieved GOES Sounder TPW and the GFS forecast values are plotted over the GOES TPW Derived Product Imagery (DPI). [1800 UT 2 Apr 2004]
Brad Pierce Air quality modeling and data assimilation. Will join ASPB on 30 April, from NASA Langley.
Issues Overall, STAR is a great place to work. There are, however, some issues that we feel should be addressed: The NOAA bureaucracy has expanded enormously over the last few years. Reporting is out of control. Science hardly matters anymore, as long as templates are properly completed. It seems as though everybody can task us, and almost everybody does. To make matters worse, some people are notorious for last minute requests. Climate is in NOAA’s and NESDIS’ mission, but there is very little financial support for it. OSD seems to have zero interest in climate. There is no promotion path for scientists in STAR; i.e., the unwritten rule is that ZP-5 is reserved for supervisors. This was discussed at the recent Science Succession Workshop (chaired by Ingrid Guch). STAR is too dependent upon OSD, OSDPD, IPO and NCEP to define our mission for us. OSD has more influence on, and is more involved in, projects than STAR management.