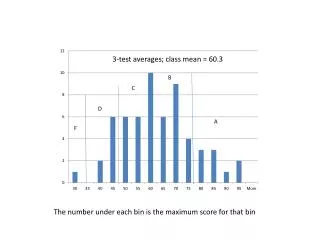
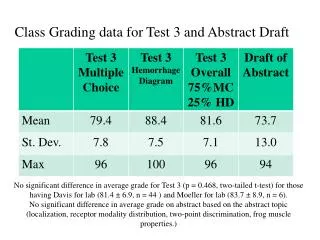
Class Grading data for Test 3 and Abstract Draft
Class Grading data for Test 3 and Abstract Draft. No significant difference in average grade for Test 3 (p = 0.468, two-tailed t-test) for those having Davis for lab (81.4 ± 6.9, n = 44 ) and Moeller for lab (83.7 ± 8.9, n = 6).

Class Grading data for Test 3 and Abstract Draft
E N D
Presentation Transcript
Class Grading data for Test 3 and Abstract Draft No significant difference in average grade for Test 3 (p = 0.468, two-tailed t-test) for those having Davis for lab (81.4 ± 6.9, n = 44 ) and Moeller for lab (83.7 ± 8.9, n = 6). No significant difference in average grade on abstract based on the abstract topic (localization, receptor modality distribution, two-point discrimination, frog muscle properties.)
Announcements as of 1 December 2008 • Last Week of Class & Lab • Renal physiology lectures • GI Physiology lecture • Urinalysis lab • Sign up for Exam Day • Moeller’s section Monday 9am • Davis’s sectionFriday 9am • Notify & commit no later than Friday of this week! • Exam Week • Take exam on Monday or Friday • Revised Abstracts due no later than 9:00 Friday • Optional (but highly recommended) Meet with professors for feedback before revising abstract.
Table 14.03 Lab this week: Extra 800 ml intake! Sidebar: some desert animals never drink and must obtain all their water in the diet.
Table 14.04 Lab this week: Extra 7 g intake!
Figure 14.05 3 stimuli for secretion of renin from JGC
Figure 14.06 4. Metabolism by tubular cells
Figure 14.12 Misleading diagram! Only 20% is filtered. Inulin used to measure GFR. Creatinine also used. Practical example: using Creatinine to assess the progression of Polycystic Kidney Disease
Figure 14.07 “Renal Handling” of various substances Net reabsorption but some excreted in urine: Example: Na+ All of filtered load is reabsorbed; none excreted in urine: Example: Glucose and amino acids+
Figure 14.08 Under physiological control
Figure 14.10 Membrane proteins are segregated into apical (luminal) and basolateral membranes.
Figure 14.14 Reabsorption and secretion in proximal tubule is NOT under hormonal control. Primary active transport of Na+ establishes a gradient for reabsorption of glucose, amino acids, etc. Reabsorption and secretion in CCD is under hormonal control. Hormones that act here: ANH, ADH, Aldosterone. Here, reabsorption of Na+ is linked to the secretion of K+.
Figure 14.11 If plasma glucose concentration exceeds 200 mg/100 ml, glucose transporters are saturated and any additional filtered glucose will be lost in the urine.
Figure 14.15 Reabsorption of Na+ which begins with Na+/K+ ATPase in basolateral membrane is the first step in reabsorption of most substances. Cl- follows Na+, and these ions create an osmotic gradient in the basolateral clefts which is the driving force for reabsorption of water by diffusion (osmosis.) and then bulk flow into peritubular capillaries.
Figure 14.17 To be emphasized during Urinalysis Lab.
Figure 14.31 Filtered bicarbonate ions are ultimately reabsorbed, but this process depends on the diffusion of CO2 through the apical membrane of tubular cells.