Download
1 / 22
220 likes | 627 Vues
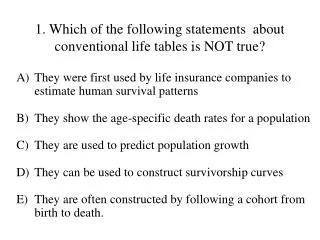
1. Which of the following statements about conventional life tables is NOT true?. They were first used by life insurance companies to estimate human survival patterns They show the age-specific death rates for a population They are used to predict population growth

E N D
1. Which of the following statements about conventional life tables is NOT true? They were first used by life insurance companies to estimate human survival patterns They show the age-specific death rates for a population They are used to predict population growth They can be used to construct survivorship curves They are often constructed by following a cohort from birth to death.
2. To measure the population density of monarch butterflies occupying a park, 100 butterflies are captured, marked with a small dot on a wing, and then released. The next day, another 100 butterflies are captured, including the recapture of 20 marked butterflies. One would correctly estimate the population to be • 2000 • 5000 • 1000 • 200 • 500
POPULATION GROWTH To predict how populations will increase or decrease, need a mathematical model. + - births deaths DENSITY
Models of Population Growth: 1) Exponential Growth Model - assumes continuous breeding • assumes during each and every time interval • there is a possibility of births and deaths
Exponential Growth Model • Change in population size (N) during a fixed time interval (t): N/ t = (b - d)N • b = births, d = deaths, N = current population size • (b – d) = r • r = the “intrinsic rate of natural increase” or the “per capita rate of increase”
Exponential Growth Model dN/dt = rmaxN • rmaxN allows us to calculate the number of new • individuals added to a population in each generation: • if rmax > 0, the population is growing • if rmax < 0, the population is declining • if rmax = 0, the population is stable
If b = 30/1000 = .03 d = 10/1000 = .01 rmax = b – d = .03 - .01 rmax = .02 N = 10,000 Then dN/dt = rmaxN = .02(10,000) = 200 new individuals N2 = 10,200 if we do this again, N3 = 10,200 + 204 new, etc. Exponential Growth Example
8,000 6,000 4,000 Elephant population 2,000 0 1900 1920 1940 1960 1980 Year Exponential Growth in Elephants in Kruger National Park
BUT NO POPULATION CAN GROW FOREVER!!! As density increases, intraspecific competition for resources increases, so births decrease and deaths increase. We have to take density into account!
Models of Population Growth: 1) Exponential Growth Model 2) Logistic Growth Model
Logistic Growth Model Takes density into account mathematically… dN/dt = rmaxN (K – N) K • K = ‘carrying capacity’, maximum stable population size that the environment can support
The exponential growth model describes the increase in population size of a population that is not constrained by resources or space. The graph shows the elephant population in Kruger National Park, which appears to have been reproducing exponentially from 1900 to 1963. From this graph, you can tell that A) none of the elephants died. B) a female elephant living around 1960 was more likely to have a baby than a female elephant living around 1920. C) the elephants adapted to the new park conditions around 1955. D) the vegetation the elephants eat could support more than 5,000 elephants. E) the more elephants there are, the more tourists will visit the park.
When will we reach our carrying capacity and what factors will limit our growth?
Estimates of world carrying capacity range from 10-15 billion, though very difficult to estimate. One recent technique: “Ecological footprint” • compares supply vs demand for • ecologically productive areas
Ecological Footprint • Ecological footprint measures the amount of arable land, pasture, forest, ocean, built-up land, and fossil energy land needed to support one person
Most ecologists agree that people should not be using more than 1.7 ha of resources if they want to be sustainable. People in the United States use an average of 10 ha. This implies that A) the ecological footprint concept is flawed. B) the U.S. has more land than other countries do. C) U.S. rates of resource consumption are too high. D) U.S. people are happier. E) U.S. people are less likely to emigrate.
16 14 12 New Zealand 10 USA Germany Australia 8 Ecological footprint (ha per person) Netherlands Japan Canada Norway 6 Sweden UK 4 Spain World 2 China India 0 16 4 2 6 8 10 12 14 0 Available ecological capacity (ha per person) Ecological Footprint Relative to Ecological Capacity Countries in red are in ecological deficit; Countries in black still have resource surpluses