1 / 1

Descriptive Statistics and Correlation Analysis of Measured Variables

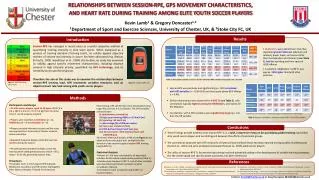
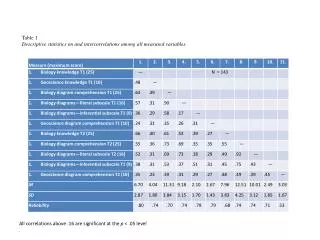
This table presents the descriptive statistics and intercorrelations among all measured variables. Each variable's mean, standard deviation, and correlation coefficients are listed. Notably, correlations above 0.16 are significant at the p < 0.05 level, indicating meaningful relationships among the variables. This analysis provides insights into the dataset, highlighting significant patterns and associations that may warrant further investigation.

Télécharger la présentation

Descriptive Statistics and Correlation Analysis of Measured Variables

An Image/Link below is provided (as is) to download presentation Download Policy: Content on the Website is provided to you AS IS for your information and personal use and may not be sold / licensed / shared on other websites without getting consent from its author. Content is provided to you AS IS for your information and personal use only. Download presentation by click this link. While downloading, if for some reason you are not able to download a presentation, the publisher may have deleted the file from their server. During download, if you can't get a presentation, the file might be deleted by the publisher.

E N D

Presentation Transcript


  1. Table 1 Descriptive statistics on and intercorrelations among all measured variables. All correlations above .16 are significant at the p < .05 level .

More Related