Download
1 / 26
260 likes | 400 Vues
This analysis explores voting inequalities in the Tonsler Park Precinct of Charlottesville, drawing on the 2004 APSA study, "American Democracy in an Age of Rising Inequality." Observations highlight Democratic mobilization efforts, the impact of income and education on voter turnout, and demographic factors influencing political participation. Notably, it discusses how low-income individuals, despite facing economic issues, often do not participate in elections. The study emphasizes the correlation between income, education, race, gender, and political party engagement within this community.

E N D
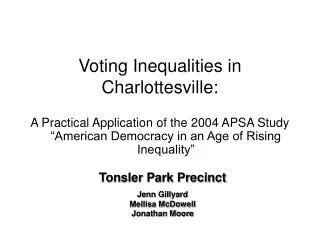
Voting Inequalities in Charlottesville: A Practical Application of the 2004 APSA Study “American Democracy in an Age of Rising Inequality” Tonsler Park Precinct Jenn Gillyard Mellisa McDowell Jonathan Moore
Precinct Map Items of Interest Political Signs Church Flag
Observations: Pre-Election • Signs overwhelmingly Democratic -Kerry/Edwards- 32 observed -Bush/Cheney- 2 observed • Income -Housing -Cars • Other factors -Churches -Minorities in the Majority
Observations: Election Day • Apparent Democratic party mobilization -Poll workers -Transportation -Signs • Partisan Handouts • Communal Ties • “Poll Watchers”
Archival Research-Census Data • Income levels -per capita income -household • (Un)Employment Stats • Poverty Level • Housing • Education
Percent of Persons 25 Years and Over with High School Diploma or More Education: 2000
Archival Research 2-Voting • Voter Turnout -TP: 58% -Charlottesville: 67% -nation: 60% • Voting History of the Tonsler Park Precinct -Kind of one-sided
Archival Research 3-Political Participation • Political party membership -Republican: 4.6% -Democrat: 12% • Campaign Contributions
Conclusions 1 • Exit polls vs demographic statistics • Income level and voting • APSA: low-income do not vote in high numbers • TP district predominantly poor so exit poll data on income should reflect this right?
Exit Poll Results: Middle Income Rules precinct * income Crosstabulation Carver Count 30 37 22 14 17 4 124 % within precinct 24.2% 29.8% 17.7% 11.3% 13.7% 3.2% 100.0% % within income 19.9% 21.0% 25.3% 14.3% 21.3% 20.0% 20.3% % of Total 4.9% 6.0% 3.6% 2.3% 2.8% .7% 20.3% Clark Count 24 42 24 28 6 0 124 % within precinct 19.4% 33.9% 19.4% 22.6% 4.8% .0% 100.0% % within income 15.9% 23.9% 27.6% 28.6% 7.5% .0% 20.3% % of Total 3.9% 6.9% 3.9% 4.6% 1.0% .0% 20.3% Tonsler Count 32 35 13 13 6 4 103 % within precinct 31.1% 34.0% 12.6% 12.6% 5.8% 3.9% 100.0% % within income 21.2% 19.9% 14.9% 13.3% 7.5% 20.0% 16.8% % of Total 5.2% 5.7% 2.1% 2.1% 1.0% .7% 16.8% Venable Count 55 30 5 13 10 8 121 % within precinct 45.5% 24.8% 4.1% 10.7% 8.3% 6.6% 100.0% % within income 36.4% 17.0% 5.7% 13.3% 12.5% 40.0% 19.8% % of Total 9.0% 4.9% .8% 2.1% 1.6% 1.3% 19.8% Walker Count 10 32 23 30 41 4 140 % within precinct 7.1% 22.9% 16.4% 21.4% 29.3% 2.9% 100.0% % within income 6.6% 18.2% 26.4% 30.6% 51.3% 20.0% 22.9% % of Total 1.6% 5.2% 3.8% 4.9% 6.7% .7% 22.9% Count 151 176 87 98 80 20 612 % within precinct 24.7% 28.8% 14.2% 16.0% 13.1% 3.3% 100.0% % within income 100.0% 100.0% 100.0% 100.0% 100.0% 100.0% 100.0% % of Total 24.7% 28.8% 14.2% 16.0% 13.1% 3.3% 100.0% income 2.00 25 3.00 50 4.00 75 5.00 100 1.00 lt 25k to 50k to 75k to 100k to 200k 6.00 200k Total precinct Total
Conclusions 1.5 • An interesting note on low-income individuals not coming out to vote -Most important issue: Indigents should care most about economic inequalities and problems, yet this did not occur in our survey, since these individuals did not come out to vote.
Conclusions 2 • Political Parties -APSA: parties only care about high income individuals -TP: since the precinct is overwhelmingly poor, parties don’t care about them, right?
Do Political Parties Care? Survey says…no
Conclusions 3 • Voting and Education -Lower levels of education and the perception of nonvoting -What did the survey say about this idea?
Education Levels By Precinct Per cen t of Cases Highest Level of Education
Conclusions 4 • Race and gender and voting -APSA: Minority men vote in disproportionately lower numbers -TP: Black males are 28% of the total population. Did they turnout to vote?
Final Conclusions • APSA article on the right track -income and voting -education and voting -gender/race and voting -political party apathy • Social Implications -Pre-election observations vs exit poll