Download
1 / 1
10 likes | 124 Vues
Time To Task Failure Of Trunk Extensors In Force Versus Position Matching Tasks Using A Modified Sorensen Protocol Saundra Motter 1 , Michael Clay 1 , Andrew Eaton 1 , Stephen Kramer 1 , David R. Russ 1,2 , Brian C. Clark 1,2 , James S. Thomas 1,2,3

E N D
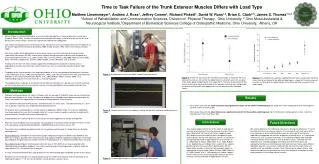
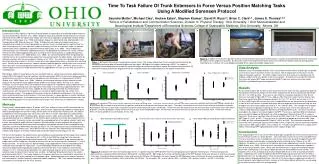
Time To Task Failure Of Trunk Extensors In Force Versus Position Matching Tasks Using A Modified Sorensen Protocol Saundra Motter1, Michael Clay1, Andrew Eaton1, Stephen Kramer1, David R. Russ1,2, Brian C. Clark1,2 , James S. Thomas1,2,3 1School of Rehabilitation and Communication Sciences, Division of Physical Therapy, Ohio University, 2Ohio Musculoskeletal and Neurological Institute,3Department of Biomedical Sciences College of Osteopathic Medicine, Ohio University, Athens, OH Introduction Low back pain (LBP) imposes a significant financial burden to society due to associated medical expenses and missed work days (Krismer, et al., 2007). Evidence shows that the back and hip extensor muscles of those with chronic LBP are significantly weaker and more easily fatigued as compared to controls without LBP (MarkkuKankaanpaa, et al., 1998) and that back fatigue has been found to be able to predict a first time episode of LBP (Biering-Sorensen, 1984). A fatigue task can require the subject to sustain a submaximal contraction of a muscle group where a constant force is exerted against a rigid restraint (i.e. force-matching task), or it can require the subject to maintain their joint at a constant angle (i.e. position-matching task) while supporting an equivalent inertial load (Enoka, et al., 2005). Force and position-matching fatigue tests have been studied extensively in the peripheral musculature with results showing time to task failure being approximately twice as long for force-matching tasks as compared to position-matching tasks (Enoka, et al., 2005; Enoka, et al., 2008). Our lab recently performed a two part position-matching versus force-matching fatigue experiment, one part being with the elbow flexors, and another on the back extensors with the same subjects (Thomas, et al., 2011). The results for the elbow flexors were consistent with prior research in that time to task failure was approximately twice as long for force-matching tasks. Results for the back extensors, however, demonstrated the opposite relationship in that time to task failure was twice as long with position-matching tasks (Thomas, et al., 2011). While our recent results show the back extensors to fatigue differently than the appendicular muscles, this was only assessed in a seated position. Most fatigue studies in the peripheral muscles are performed at a submaximal contraction approximately equal to 20% of a subject’s maximal voluntary isometric contraction (MVIC) of that muscle group secondary to differences in time to task failure not being apparent with contractions at a higher percent of MVIC (Enoka, et al., 2005; Enoka, et al., 2008). However, current prone measures of back extensor muscle fatigue are measured with loads approximately 40-80% of a subject’s (MVIC) (Elfving, et al., 2007). Therefore, the current prone measures of back extensor fatigue are incapable of measuring differences in force and position-matching tasks with equivalent inertial loads at an intensity of approximately 20%. We created a modified Sorensen test that is capable of measuring fatigue with both force and position-matching tasks with equivalent inertial loads at an intensity of approximately 20% by using a trunk counterbalance system. The purpose of the present study was to determine differences in time to task failure in position and force-matching tasks in the trunk extensors in a prone position in healthy individuals during low load conditions. A secondary area of focus of this study was the differences between men and women regarding patterns of muscle activation and change in max force to assess differences in fatigue. Methods Sixteen healthy college-aged subjects, 9 women and 7 men, without a history of LBP volunteered for the study. The experiment was a cross-over design, with half of the subjects being randomly assigned to the force-matching fatigue task on the first day, and the other half to the position-matching task. All subjects completed the remaining fatigue task 48-72 hours after the first session. EMG data was collected from bilateral erector spinae (ES), multifidus (MUL), gluteus maximus (GM), and hamstring (HS). The subject was positioned prone on a modified plinth that fixed the pelvis and lower extremities but allowed the torso to be suspended. One pulley system connected the suspended portion of the table to a weight stack, and another connected the weight stack to a load cell. With both pulley systems engaged, the frame of the upper portion of the table was lowered and the subject’s torso weight was able to be transmitted through the pulley system to be detected by the load cell (Figure 1A). The subject’s torso was counterbalanced by adding weight to the weight stack. Next, MVIC of the trunk extensors was determined by connecting an inelastic strap between a vertically oriented load cell and the subject’s torso (Figures 1B, 2A). For force-matching tasks, the subject’s torso was completely counterbalanced and the subject was required to pull up on the load cell at a force equal to 15% ± 20% of their MVIC by using their trunk extensors (Figure 1C). The position-matching protocol required 15% of the subject’s MVIC to be removed from the weight stack and the subject was required to maintain their torso at a given position (horizontal ± 1°) for as long as possible. The torso angle was determined by using a potentiometer that was attached to both a stationary and a movable arm (Figure 2B). Visual and auditory feedback was provided to the subject during both fatigue tasks regarding the subject’s current exerted force or the subject’s current position (Figures 1C, 2C). Task failure was defined as the subject failing to keep his or her force or position in the specified range for greater than 3 consecutive seconds. Immediately following task failure, the subject performed another MVIC. The median frequency of the power spectrum was calculated for consecutive 2-second intervals (with a 50% overlap) of the recorded signal. Normalized slope of the median frequency was calculated as: (median frequency slope/initial median frequency) * 100. Initial median frequency was calculated as the average over the first 5 seconds. A B C A B C Figure 2. A) Depicts the load cell in position for MVIC testing and force during force-matching tasks. Load cell is positioned horizontally for measuring the subject’s torso weight (not pictured). B) Shows the setup of the potentiometer which was used to identify the subject’s position during position-matching tasks. C) Shows the visual feedback provided to the subject during both fatigue tasks. Data Analysis Separate 2-way mixed-model ANOVAs were used to determine the effects of load type and gender on time to task failure, maximum force at task failure, ratio of fatigue force to max force, and the slope of the power spectrum. The within-subjects factor was task (force versus position) and the between-subjects factor was gender (male versus female). To examine muscle specific effects of task failure on fatigue, MPF slope and normalized MPF slope was tested using mixed model ANOVAs and followed by pairwise comparisons. Results As illustrated in Figure 3A, the time to task failure for the trunk extensors was significantly longer for the position-matching task (58.3±7.70 min) when compared to the force-matching task (35.8±6.55 min) (F(1,14) =5.52, p=.034). There was no main effect or interaction of gender on time to task failure as illustrated in Figure 3B (F(1,14) =.068, p=.798). Figure 3C shows that max force at task failure was significantly different between genders (F(1,14)=7.11, p=.018), but not task (F(1,14) =.198, p=.663). Figure 3D confirms that initial strength differences are the reason for the differences in max force at task failure, as gender differences were no longer present when examining the ratio of fatigue max force to pre-fatigue max force (F(1,14) =.004, p=.948). The average ratio of fatigue force to max force for position-matching was 67.9% and was 62.3% for force-matching (F(1,14) =.943, p=.348) indicating insignificant differences of fatigue between tasks. There was no effect of task type on the slope or normalized slope of the MPF. There was a significant difference between mean normalized slopes of GM and ES, (p=.025) and between GM and HS (p=017) as shown in Figure 4A. There was a significant effect of muscle on MPF slope (F=5.172, p=.016) and normalized MPF slope (F=4.181, p=.031). There was also an interaction of gender by muscle on MPF slope (F=4.009, p=.034) and normalized MPF slope (F=5.219, p=.015). The interaction of gender and muscle on mean normalized slope (p=.015) of GM is seen in Figure 4B, and the interaction of gender and muscle on MPF slope of GM is seen in Figure 4C. Females had significantly less fatigue of the GM as measured by MPF slope compared to male subjects (Figure 4C). Conclusions This study provides the first test of the effect of load type and gender on the time to task failure of the trunk extensor muscles in a prone position. Consistent with our prior results measuring differences in time to task failure in the seated position, time to task failure was found to be approximately 50% longer for position-matching tasks as compared to force-matching tasks (Thomas et. al, 2011). However, this pattern is in contrast to that typically observed in appendicular muscles (Enoka, et al., 2005; Enoka, et al., 2008). With torso mass controlled for, there were no differences in gender in time to task failure between tasks. While there were differences in fatigue force between gender, there were no differences in the ratio of fatigue force to max force between task or gender. This indicates similar levels of fatigue at task failure despite differences in time to task failure between tasks. Additionally, this study revealed that ES and HS fatigue significantly more than the GM as performed within this testing protocol. When accounting for gender, it was observed that the GM of female subjects fatigued significantly less than that of the male subjects suggesting that either this muscle group is more fatigue resistant in females or that females did not activate this muscle group to the extent of males within this testing protocol. Figure 1.A) Depicts the process of weighing the subject’s torso. The arrows indicate how the torso weight is transmitted to the horizontally positioned load cell located underneath the subject. B) Depicts the subject performing a MVIC. The subject is completely counterbalanced and the load cell below the subject is positioned vertically to register the subject’s extension force. C) Depicts the subject performing a fatigue task with the computer monitor for feedback placed in the subject’s visual field. A B C D Figure 3.A) Compares time to task failure in position and force-matching tasks. There was a main effect of task on time to task failure with position-matching tasks having a longer time to task failure. B) Illustrates time to task failure in position and force-matching tasks for females and males. There was a main effect of task, but no main effect or interactions of gender. C)Compares max force at task failure in position and force-matching tasks for males and females. There were no main effects of task on maximum force at task failure, but a main effect of gender. Females produced a smaller amount of force at task failure compared to males. D) Illustrates the ratio of max force at task failure to maximum force. There were no main effects of task or gender or any interactions for this ratio. A B C * * * * Figure 4. A) Compares the mean normalized slope of the mean power frequency (MPF) between each muscle group during the position-matching task. Pair-wise comparisons demonstrated a significant difference between GM and ES , and GM and HS. B) Compares the mean normalized slope of the MPF between males and females for each muscle group. There was a significant difference between males and females for GM only. C) Compares the mean slope of the MPF between males and females for each muscle group. Again, there was a significant difference between males and females for GM only. For all graphs, ES = erector spinae, MUL = multifidus, GM = gluteus maximus, and HS = hamstrings.