Weather Station Data Analysis
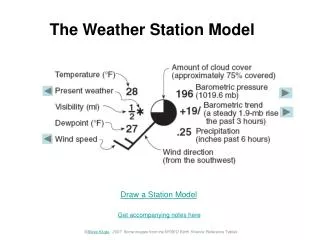
Weather Station Data Analysis. By Anthony Wilson. day. Instead of producing a graph, the temperature from that day can be read off and displayed as a string, or more likely, using the Textline Class from Graph2D, which produces textual output.

Weather Station Data Analysis
E N D
Presentation Transcript
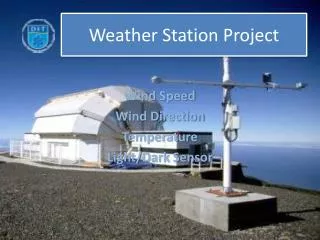
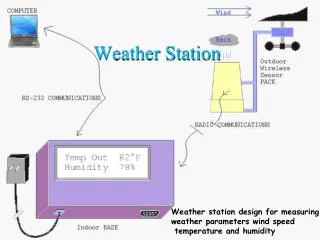
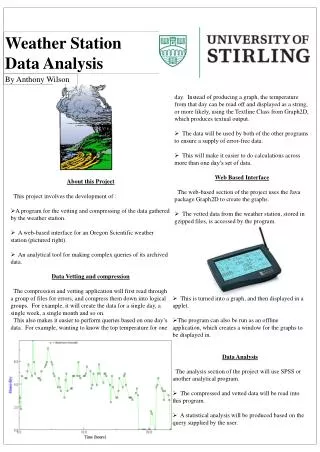
Weather Station Data Analysis By Anthony Wilson • day. Instead of producing a graph, the temperature from that day can be read off and displayed as a string, or more likely, using the Textline Class from Graph2D, which produces textual output. • The data will be used by both of the other programs to ensure a supply of error-free data. • This will make it easier to do calculations across more than one day’s set of data. • Web Based Interface The web-based section of the project uses the Java package Graph2D to create the graphs. • The vetted data from the weather station, stored in gzipped files, is accessed by the program. • About this Project • This project involves the development of : • A program for the vetting and compressing of the data gathered by the weather station. • A web-based interface for an Oregon Scientific weather station (pictured right). • An analytical tool for making complex queries of its archived data. • Data Vetting and compression • The compression and vetting application will first read through a group of files for errors, and compress them down into logical groups. For example, it will create the data for a single day, a single week, a single month and so on. This also makes it easier to perform queries based on one day’s data. For example, wanting to know the top temperature for one • This is turned into a graph, and then displayed in a applet. • The program can also be run as an offline application, which creates a window for the graphs to be displayed in. • Data Analysis • The analysis section of the project will use SPSS or another analytical program. • The compressed and vetted data will be read into this program. • A statistical analysis will be produced based on the query supplied by the user.