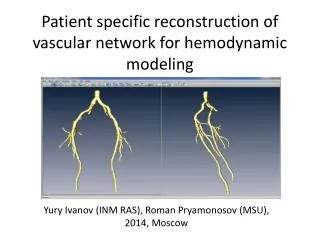
Patient-specific Cardiovascular Modeling System using Immersed Boundary Technique
260 likes | 422 Vues
Patient-specific Cardiovascular Modeling System using Immersed Boundary Technique. Wee-Beng Tay a , Yu-Heng Tseng a , Liang-Yu Lin b , Wen-Yih Tseng c.

Patient-specific Cardiovascular Modeling System using Immersed Boundary Technique
E N D
Presentation Transcript
Patient-specific Cardiovascular Modeling System using Immersed Boundary Technique Wee-Beng Taya, Yu-Heng Tsenga, Liang-Yu Linb, Wen-Yih Tsengc aHigh Performance Computing & Environmental Fluid Dynamic Laboratory, Department of Atmospheric Sciences, National Taiwan University, Taipei, Taiwan (yhtseng@as.ntu.edu.tw) bNational Taiwan University Hospital, Taipei, Taiwan cCenter for Optoelectronic Biomedicine, National Taiwan University College of Medicine, Taipei, Taiwan * Special thanks to Peskin and Mcqueen for providing the CFD code
Outlines • Introduction • Patient-specific Cardiovascular Modeling System • 4-D MRI system • Numerical methods • Results and discussions • Conclusion and future work
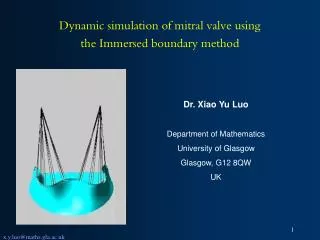
Introduction • Develop a CFD based, patient-specific cardiovascular modeling system • Facilitate physicians’ diagnosis at early stage through hybrid CFD simulation and 4-D MRI • Use Immersed boundary method (IBM) to simulate fluid-elastic interaction of heart • Investigate the vortex dynamic and effects of reservoir pressure boundary condition (RPBC) on the flows in Left Ventricle (LV)
Patient-specific Cardiovascular Modeling System • Methodology
Patient-specific Cardiovascular Modeling System • 4-D phase contract magnetic resonance imaging (PC-MRI) system • Currently at the National Taiwan University Hospital • Images acquired using an eight-channel phased-array body coil • Time-resolved 3D hemodynamic velocity fields • Allows one to reconstruct the 3D images of the heart over a cardiac cycle • Data comprises of both healthy volunteer as well as patients with cardiac problems for comparison
Patient-specific Cardiovascular Modeling System • Image resolution at 192x256x8 • Extracted slice at z=3, T*=0.2 1T=1 heart cycle
Numerical Method – IBM (Lai and Peskin, 2000) • Incompressible Navier-Stokes equations (f represents force density) • Interaction between immersed boundary, fluid and boundary forces
Sensitivity of the pressure inflow conditions Reservoir pressure boundary condition (RPBC) 5 sources of RPBC at (a) superior (b) inferior vena cava (c) pulmonary vein (d) artery (e) aorta 10/2/2014 9
Sensitivity of the pressure inflow conditions • Influence of reservoir pressure boundary condition (RPBC) • Investigate the effects/impacts of different pressure BC on the simulation results • Study vortex dynamics of left ventricle (LV)
Sensitivity of the pressure inflow conditions • RPBC vs. T (Run 1 to 4)
Sensitivity of the pressure inflow conditions • PV and Aorta RPBC vs. T (Run 1 to 4) 10/2/2014 12
Results and Discussions • Hemodynamic comparison for PV Decrease and reverse in flow rate for Run 1 to 3 despite mitral valve closure Higher pressure BC gives higher blood inflow at the PV Flow rates decrease and even reverse for all cases except Run 4
Results and Discussions • Hemodynamic comparison for aorta Minimal difference in flow rate of aorta for different data sets during initial filling of blood in the LV When systole phase begins , there is a large outflow to deliver oxygenated blood to other parts of the body
Results and Discussions Comparison with Fortini et al. results Magnitude of the PV flow rate from Run 1 is generally twice as high as that of Fortini et al Current outflow is about 5 times that of Fortini et al. 10/2/2014 15
Results and Discussions • 2-D Vorticity visualization and verification (Run 1) 2-D vorticity plots obtained by extracting a slice of the Z vorticity at z=0.56. A pair of opposing signs vortices can be seen for all data sets Similar experimental results from Fortini et al. and Gharib et al.
Results and Discussions 3-D Iso-surface vorticity magnitude visualization T=0.06 – Flow entering LV, vortex rings start to get connected T=0.37 – Reached a more mature stage, vortices stabilized, showing connected vortex rings T=0.56 – Only left a small region of weak vorticity 10/2/2014 17
Results and Discussions (Gharib et al., 2006) • Vortex formation time Tv • A good indicator of the cardiac health of the patient • EDV = LV end-diastolic volume (LV filling), • = time-averaged mitral (annulus) valve diameter, • EF = ejection fraction, • ESV = LV volume at the end of systole (LV ejection), • SV = the stroke volume, difference between ESV and EDV
Results and Discussions • Vortex formation time Tv • Expected value of Tv for healthy volunteer is 3.3< Tv <5.5 • Tv very sensitive to small differences in . Power cube in equation causes small differences to be magnified.
Results and Discussions • Kinetic Energy (KE) of 4-D PC-MRI system 1st peak of KE (initial diastole), higher 2nd peak of KE (atrial contraction), lower
Results and Discussions • Kinetic Energy (KE) of Run 1 (z=0.56 slice) 2nd lower peak of KE (atrial contraction) 1st higher peak of KE (LV filling)
Exceptionally high erroneous 3rdpeak from Run 3 Run 2 (-25% PV) also has 2 peaks, but the later peak is much higher than the first Total of 3 peaks for Run 1 and 3, with 1st peak higher than 2nd Similar peaks for Run 4, but solution diverges after 0.8T Results and Discussions • Maximum KE vs. T for Run 1 to 4
Results and Discussions • Surface pressure analysis Significant reduction in surface pressure after systole High surface pressure during systole, especially in the front
Results and Discussions Surface shear stress analysis High shear stress during systole, near the aorta High shear stress, now near apex of the heart 10/2/2014 24
Conclusions and future work • Patient specific cardiovascular modeling system • Simulation of heart using IBM • 4-D PC-MRI system • Investigate the effect of RPBC on different variables such as KE, vorticity etc • Verified with experimental results from MRI and other means through KE, vorticity • Visualization of pressure and shear stress distribution on heart surface • Further investigation of the realistic reservoir pressure BC is required • Future work to include input of patient specific data in CFD code