Download
1 / 19
190 likes | 396 Vues
Status, Evaluation and New Developments of the Automated Cloud Observations in the Netherlands. Introduction Status and Experiences New/recent developments Aeronautical observations Mixing layer height Nubiscope. Wiel Wauben, Henk Klein Baltink, Marijn de Haij, Nico Maat, Han The

E N D
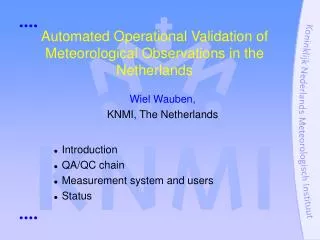
Status, Evaluation and New Developments of the Automated Cloud Observations in the Netherlands • Introduction • Status and Experiences • New/recent developments • Aeronautical observations • Mixing layer height • Nubiscope Wiel Wauben, Henk Klein Baltink, Marijn de Haij, Nico Maat, Han The KNMI, The Netherlands
Introduction • Automated cloud observations for synop and climatological reports in MetNet since Nov. 2002.Observers at airports only for aeronautical observations. • Vaisala LD-40 ceilometer in combination with cloud algorithm (30’ cloud base cloud cover/amounts). • Cloud information centrally available every 10 minutes. • Currently 24 ceilometer locations in the Netherlands,+ 4 air bases in 2006/2007,+ 5 platforms in North Sea in 2006/2007. • Changes for automation of aeronautical observations.
MetNetCeilometer locations 4 KNMI Navy Air Force Nogepa
Experiences • 6 stations /3 years of data for intercomparison manned/automated. • Results /scores in general the same.
Experiences • Missing high clouds vs moist layer reported as cloud. • “Gaps” in cloud deck during precipitation. • Missing information during shallow fog. • Faulty isolated hits. • Fewer cases with1 and 7 okta compared to observer. • Missing spatial representativity.
Nubiscope • Scanning IR radiometer • 1080 measurements every 15 minutes Tested at KNMI Dec 2005 to Feb 2006 Technical report 291 www.knmi.nl/~wauben
Nubiscope parameters • Measures 1080 sky temperatures (10° azimuth, 3° zenith) and ground temperature • Stores raw and derived data • Data extracted off-line Parameters available every 15 (10) minutes: • Total cloud cover • Cloud cover and base for main cloud deck • Cover and base for low, middle and high clouds • Cloud mask • Cloud base height for zenith measurements • Ceiling
Conclusions • Network of near real-time automated cloud observations in the Netherlands (1734 locations). • Fully automated synop, climatological and aeronautical (cloud) reports. • Inclusion of CB/CTU cloud type for aviation requires improvement. • Optimisation of automated cloud observations (sensor; cloud algorithm; combination of sensors e.g. multi-ceilometer, satellite, Nubiscope, validation). • New mixing layer height product.
Aeronautical cloud observations • Automated METAR/SPECI reports in mid 2005 during closing hours of regional airports. • SYNOP 30 1’ data METAR 50 12” dataAllowed layer separation, METAR coding. • Evaluation of ceiling (height of lowest cloud layer where cloud amount exceeds 4 okta). • In 2006 evaluation of CB/TCU determination from lightning and radar reflectivity threshold.
Mixing layer height determination • LD-40 backscatter profile shows aerosol signal. • Gradient between top of mixing layer and free troposphere.
Evolution convective ML C1 hSNR MLH2 MLH1 Quality Index Good > 0.50 Weak > 0.25 Poor≤ 0.25 MLH profiler
Limited range for MLH estimation MLH profiler/radiosonde hSNR Quality Index Good > 0.50 Weak > 0.25 Poor≤ 0.25
diurnal cycle • De Bilt 2000-2005 • Monthly variability of MLH diurnal cycle captured • Spring/summer: limited vertical range for MLH estimation LEGEND SNR stop level MLH1
Results: detection rates • De Bilt 2000-2005 • Overall detection rate: 45-70% • ‘Good’ QI: 20-30 % • Spring/summer: Largest contribution of ‘Poor’ estimations