Variance (%)
Variance (%). Number of principle component. Supplemental figure 1. Supplemental figure 2A. Supplemental figure 2B. Supplemental figure 2C. Supplemental figure 3A. Supplemental figure 3B. Supplemental figure 3C. Supplemental figure 3D. Supplemental figure 3E. Variance (%).


Variance (%)
E N D
Presentation Transcript
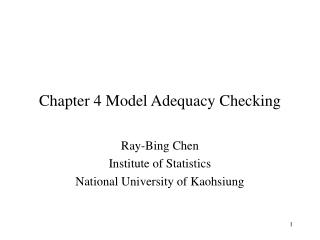
Variance (%) Number of principle component Supplemental figure 1
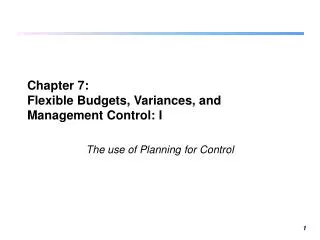
Variance (%) Number of principle component Supplemental figure 4
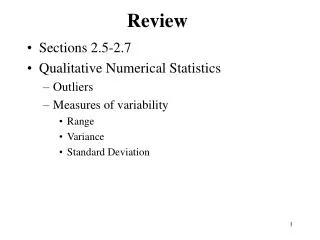
25 20 Cd.II-218 K-218 Co.II-218 15 10 Pb.II-218 5 K-214 PC-#3 0 K-215 Pb.II-214 -5 Cd.II-215 Cd.II-214 Co.II-215 Pb.II-215 -10 -15 -20 Co.II-214 -25 -50 -40 -30 -20 -10 0 10 20 30 40 50 PC-#1 Supplemental figure 5B
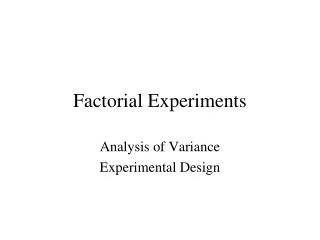
25 20 Cd.II-218 K-218 Co.II-218 15 10 Pb.II-218 5 K-214 PC-#3 0 K-215 Pb.II-214 -5 Pb.II-215 Cd.II-215 Cd.II-214 Co.II-215 -10 -15 -20 Co.II-214 -25 -30 -20 -10 0 10 20 30 PC-#2 Supplemental figure 5C
Supplemental figures (supplemental online material) Supplemental figure 1: Variance explained by the individual principle components (corresponding to Figure 1). Supplemental figure 2: Principle component analysis based on only the first two principle components (corresponding to Figure 1). A. PC-#1: principle component no. 1, PC-#2: principle component no. 2; B. PC-#1: principle component no. 1, PC-#3: principle component no. 3; C. PC-#2: principle component no. 2, PC-#3: principle component no. 3. Supplemental figure 3: Kegg pathway mapping of genes deregulated by incubation of normal human bronchial epithelial cells with a combination of 15 µg/l Cd(II), 25 µg/l Co(II) and 550 µg/l Pb(II). Dark red colour indicates that the respective gene is at least two-fold upregulated in two patients. Light red colour means upregulation in at least three patients. Similarly, dark green indicates an at least two-fold upregulation in two patients, whereas light green colour highlights genes downregulated in at least three patients. A. Glutathione metabolism, B. Pyrimidine metabolism, C. Purine metabolism, D. Biosynthesis of steroids, E. Cytochrome P450 metabolism. Supplemental figure 4: Variance explained by the individual principle components (corresponding to Figure 3). Supplemental figure 5: Principle component analysis based on only the first two principle components (corresponding to Figure 3). A. PC-#1: principle component no. 1, PC-#2: principle component no. 2; B. PC-#1: principle component no. 1, PC-#3: principle component no. 3; C. PC-#2: principle component no. 2, PC-#3: principle component no. 3.