Download
1 / 33
330 likes | 409 Vues
Explore how uncertainties, probabilities, and preferences affect decision-making in scenarios like lotteries and insurance. Understand expected utility functions and the psychology behind choosing between risky options.

E N D
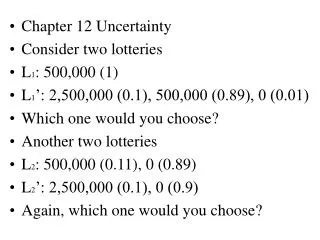
Chapter 12 Uncertainty • Consider two lotteries • L1: 500,000 (1) • L1’: 2,500,000 (0.1), 500,000 (0.89), 0 (0.01) • Which one would you choose? • Another two lotteries • L2: 500,000 (0.11), 0 (0.89) • L2’: 2,500,000 (0.1), 0 (0.9) • Again, which one would you choose?
Risk is a fact of life. In addition to lotteries, we face risks when walking across the streets (especially in Taipei), making an investment or even getting married. • Since there exist risks, outcomes are not deterministic and assume they can be described by a probability distribution. • Think about states of nature (s1,s2, …,sn) with probability (1, 2, …,n). On state i, the consumption is ci.
Hence, we can think of a contingent consumption plan (c1,c2, …,cn). And draw a consumer’s preference on the consumption plane. Notice that the contingent consumption plan is a specification of what will be consumed in different states of nature. And the preference on consumption plans certainly may depend on the probabilities of states, (1, 2, …,n).
An example: A lottery ticket costs 1 dollar. The rule is there will be a winning number drawn from 1-100, each with equal probability. When you buy a ticket, you can choose a number. If the number you choose matches the winning number, you get 100 dollars, otherwise, you get nothing. Your initial wealth is 200 dollars. • Each state si could be the event that number i is the winning number. So (1, 2, …,n)=(0.01,0.01, …,0.01).
If you do not buy any lottery ticket, then your consumption does not depend on the state. Hence (c1,c2, …,cn)=(200,200, …,200). • If you buy one ticket and choose number 1, then (c1,c2, …,cn)=(299,199, …,199). • If you buy one ticket of number 1, another of number 2, then (c1,c2, …,cn)=(298,298,198, …,198).
Another example: Suppose there is a prob of 1-p that some loss D occurs. Suppose there is an insurance contract which pays the person 1 dollar in exchange for r<1 dollar of premium. The initial wealth of the person is W. Then we can model the situation as there are two states, (s1,s2) where state 1 is that there is no loss and state is that there is a loss. Hence (1, 2)=(p,1-p).
If the consumer does not buy any insurance, then his consumption would be (W,W-D). • If he buys K dollars of insurance, then he has to pay Kr dollars no matter what the state of nature is and will get paid K dollars when there is a loss. Hence his consumption becomes (W-Kr, W-D+K-Kr). So if we plot c1 on the x, c2 on the y, then his budget line will have the slope of -(1-r)/r.
Given we have the budget line and the consumer must have some preference over (c1,c2), so we can derive his optimal consumption plan and therefore determines how much insurance will he buy. • Now what does a “fair” insurance policy mean? This means on average the insurance company breaks even. Hence, (1-p)K=Kr or r=1-p. intuitive, since the premium charged is simply the probability that the loss will occur.
We now turn to discuss the preference over the consumption plans (c1,c2). As before, MRSc1,c2 =∆c2/∆c1, meaning if you give me one more unit of c1, how many units of c2 would I be willing to give up to stay indifferent. Intuitively, this certainly depends on how likely I think the two states (s1,s2) are likely to be. For instance, if I think the state s1 is quite impossible, then I would not be willing to give up many units of c2.
This suggests that the preference over the consumption plans (c1,c2) depends also on (1, 2). • Hence in general, we write the utility function representing the preference over the consumption plans (c1,c2) as u(c1,c2,1, 2). • Some examples: • u(c1,c2,1, 2)= 1c1+2c2 (Take the expected value of the consumption.)
u(c1,c2,1, 2)= c11c22 • u(c1,c2,1, 2)= 1ln(c1)+2ln(c2) (Take the expected value of ln of the consumption.) • The utility forms of the first and the third are quite special that we call them having the form of expected utility. • In general, the utility having the form of u(c1,c2,1, 2)= 1v(c1)+2v(c2) is a expected utility function. I.e., the utility is the expected value of some utility function v() of consumption.
Let us examine whether your utility has the form of expected utility. Suppose you do, then there exists a v() so that: • L1: v(500,000) • L2: 0.1v(2,500,000)+0.89v(500,000)+0.01v(0) • L3: 0.11v(500,000)+0.89v(0) • L4: 0.1v(2,500,000)+0.9v(0) • Hence, L1wL2 -0.1v(2,500,000)+0.11v(500,000)-0.01v(0)≥0
Similarly, L3wL4 -0.1v(2,500,000)+0.11v(500,000)-0.01v(0)≥0 (the Allais paradox) • So if you choose 1 over 2 but 4 over 3 (this happens to a lot of lab subjects) or you choose 2 over 1 but 3 over 4, then your preference cannot be represented by the expected utility function. There is nothing wrong about it, it just shows that the expected utility function cannot accurately represent your preference.
u(c1,c2,1,2)= 1c1+2c2= 1v(c1)+2v(c2) where v(c)=c • u(c1,c2,1,2)= 1ln(c1)+2ln(c2)= 1v(c1)+2v(c2) where v(c)=lnc • We can think of v(c) as the utility of certain consumption. In this sense, then u() is the expected utility of consumption (c1, c2). • Utility function u() of this particular form is called a von Neumann-Morgenstern utility function or an expected utility function.
The function v() is called the Bernoulli function by some. • If we have an expected utility function u and we multiply it by some positive constant a and add a constant b so f(u)=au+b, then F≡f(u) is also an expected utility function. • F(c1,c2,1,2)=f(u(c1,c2,1,2))=au(c1,c2,1, 2)+b=a(1v(c1)+2v(c2))+b=1(av(c1)+b)+2(av(c2)+b)=1f(v(c1))+2f(v(c2)), so F is also an expected utility function.
This kind of transformation (multiplying a positive constant and adding a constant) is called a positive affine transformation. Turns out that given an expected utility function, if you apply a positive affine transformation, then you get another expected utility function. Moreover, any other kind of transformation will destroy the expected utility property.
The most important property characterizing the expected utility is the independence assumption. • For instance, if u(c1,c2,c3,1,2 ,3)≥u(c1’,c2’,c3,1,2 ,3) then u(c1,c2,d3,1,2 ,3) ≥u(c1’,c2’,d3,1,2 ,3). We can think of this as with prob 3, state 3 occurs. In the first case, c3 is the outcome while in the second d3. However, it does not matter what the outcome in state 3 is.
In state 3, some common outcome will occur. Since it is common, it will not affect our preference. Hence our preference is determined solely by the fact that 1v(c1)+2v(c2) ≥1v(c1’)+2v(c2’). This has some flavor of independence. • Notice that before, (c1,c2,c3) is consumed at the same time. So it may be the case that when consuming c3,we prefer (c1,c2) to (c1’,c2’) while when consuming d3, our preference is reversed.
It is different now because if state 3 occurs, states 1 or 2 will not occur. • Notice that with u(c1,c2,c3,1,2,3)= 1v(c1)+2v(c2)+3v(c3), MRS12=MU1/MU2=1v’(c1)/2v’(c2) which does not depend on c3. • Is it reasonable? Consider going to Venice (V), watching a movie (M) about Venice and staying home (H). However, I may prefer V(0.99)+H(0.01) to V(0.99)+M(0.01) because the latter entails disappointment. (another outcome of the lottery)
Moreover, comparing L1 (500,000, 1) to L2 (2,500,000, 0.1; 500,000, 0.89; 0, 0.01) I may choose L1 because there is a possibility that I will regret that I should have chosen otherwise if I have chosen L2 and 0 is realized. On the other hand, there is no such clear-cut regret potential exists between L3 (500,000, 0.11; 0, 0.89) to L4 (2,500,000, 0.1; 0, 0.9) (a choice not made).
A person who prefers a certain given outcome to a risky outcome with the same expected income is a risk averter. When a person is indifferent, he is risk neutral. Finally, if a person prefers a risky outcome to the certain outcome, then he is risk loving. • Draw a figure with v() concave, linear, convex to illustrate.
Go back to the insurance example. Assume a risk averse expected utility maximizer. Then 1) on an indifference curve, when c1 is greater, c2 has to lower. 2) |MRS12|=MU1/MU2=1v’(c1)/2v’(c2), since v() is concave, when c1 is greater and c2 is lower, then v’(c1)/v’(c2) is lower and hence |MRS12| is smaller. So we have the usual (convex to the origin) indifference curves. (average vs extreme)
If insurance is fair, i.e. r=1-p, then at optimum, it must be |MRS12|=pv’(c1)/[(1-p)v’(c2)]=(1-r)/r. So v’(c1)=v’(c2) or c1=c2. This means, in words, facing a fair insurance, a risk averse, expected utility maximizer will choose to fully insure. • On the other hand, if the insurance company makes some profit, then r>1-p and p>1-r. So v’(c1)/v’(c2)=(1-r)(1-p)/pr<1. Since v’’<0, c2< c1, in words, wealth when the loss occurs is not as high. Not fully insured.
At the 45 degree line, since c1=c2, with an expected utility function, |MRS12|=p/(1-p) the relative likelihood ratio of state 1 to state 2. • Look at another example. Suppose a consumer has wealth w and is considering to invest some amount x in a risky asset. The asset has a return rate of rg in the good state and -rb in the bad state. Good state occurs with probability p and bad with 1-p.
If we plot outcomes in the good state on the X and those in the bad state on the Y. When the consumer invests x dollars, then the outcomes are (w-x+(1+rg)x, w-x+(1-rb)x)=(w+rgx, w-rbx). Investing one dollar would decrease wealth at the bad state by rb and increase wealth at the good state by rg. Hence, the slope of the budget line is -rb/rg. If the asset has a strictly positive return, then prg-(1-p) rb>0 or p/(1-p)> rb/rg.
The expected utility maximizer has |MRSgb|=p/(1-p) when he does not invest anything in this risky asset and has wealth (w,w). This implies |MRSgb| is greater than the slope of the budget line. Hence when facing a better than fair gamble, a risk averter will invest a bit in the risky asset, no matter how risk averse he is.
This is the same logic that we saw before. When the insurance company is making a profit, selling insurance is like a positive risky asset. Hence a risk averter will not be fully insured, just like selling some insurance. • Turn to the benefits of diversification. This summer there is a half of chance to be rainy and another half sunny. If it is rainy, then every one dollar you invest in a raincoat company becomes 2 dollars.
And every dollar invested in a sunglasses company becomes 0.5 dollar. Likewise, if the summer is sunny, every dollar you invest in the raincoat (sunglasses) company becomes 0.5 (2) dollar. • Call state 1 the rainy state and 2 the sunny state. • If you invest 100 dollars on the raincoat company, you get (200, 50) and your utility is 0.5v(200)+0.5v(50). If you invest 50 on the raincoat and 50 on the
Sunglasses, then you get (125, 125) and the utility is v(125). A risk averter would have v(125)>0.5v(200)+0.5v(50). So diversification pays off. Assets moving in the opposite direction is like providing an insurance, which will be valuable to someone who dislikes risks. Likewise, the value of an asset depends on how much this asset moves in the opposite direction with the rest of your assets.
Risk spreading: each individual has 35,000 and face a 0.01 probability of 10,000 loss. Suppose there are 1,000 individuals and their probabilities of the loss are independent. Then there is room to spread the risk. Suppose the 1,000 individuals decide that if anyone incurs the 10,000 loss, each of the 1,000 individuals will give the person 10 dollars. Then on average, there are 10 houses burnt down and so in most of the time, each has 35,000-10*10=34,900.
If they do not insure each other, then with probability 0.99, each has wealth 35,000 and with probability 0.01, each has wealth 25,000. The expected wealth is 34,900. Since a risk averter likes the sure outcome then the risky outcome with the same expected value, this explains why insurance company can make a profit. • In fact, you can self insure by saving over time.