Gene Expression Analysis of Mycorrhizal and Pathogen Interactions in Pot Cultures
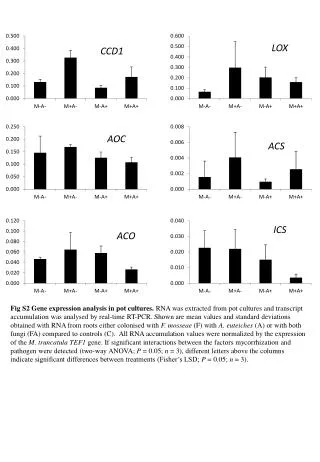
This study investigates the gene expression profiles in pot cultures where roots are colonized by either the mycorrhizal fungus Funneliformis mosseae (F), the pathogen Aphanomyces euteiches (A), or both (FA), compared to controls (C). RNA was extracted and analyzed through real-time RT-PCR. Mean values and standard deviations were calculated, normalizing all RNA accumulation against the M. truncatula TEF1 gene expression. Significant interactions between mycorrhization and pathogen presence were assessed via two-way ANOVA, highlighting relevant treatment differences.

Gene Expression Analysis of Mycorrhizal and Pathogen Interactions in Pot Cultures
E N D
Presentation Transcript
LOX CCD1 AOC ACS ICS ACO Fig S2 Gene expression analysis in pot cultures. RNA was extracted from pot cultures and transcript accumulation was analysed by real-time RT-PCR. Shown are mean values and standard deviations obtained with RNA from roots either colonised with F. mosseae (F) with A. euteiches (A) or with both fungi (FA) compared to controls (C). All RNA accumulation values were normalized by the expression of the M. truncatula TEF1 gene. If significant interactions between the factors mycorrhization and pathogen were detected (two-way ANOVA; P = 0.05; n = 3), different letters above the columns indicate significant differences between treatments (Fisher’s LSD; P = 0.05; n = 3).