Download
1 / 24
321 likes | 1.22k Vues
Mineral Stability Diagrams and Chemical Weathering of Feldspars. Albite Jadeite + Quartz d D G = D VdP - D SdT and G, S, V values for albite, jadeite and quartz to calculate the conditions for which D G of the reaction: Ab = Jd + Q D G = 0. Method:.

E N D
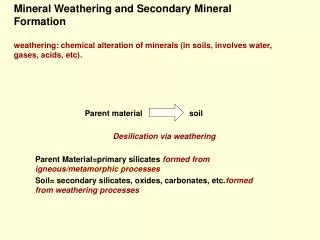
Mineral Stability Diagrams and Chemical Weathering of Feldspars
Albite Jadeite + Quartz dDG = DVdP - DSdT and G, S, V values for albite, jadeite and quartz to calculate the conditions for which DG of the reaction: Ab = Jd + Q DG = 0 Method: • from G values for each phase at 298K and 0.1 MPa calculate DG298, 0.1 for the reaction, do the same for DV and DS •DG at equilibrium = 0, so we can calculate an isobaric change in T that would be required to bring DG298, 0.1 to 0 0 - DG298, 0.1 = -DS (Teq - 298) (at constant P) • Similarly we could calculate an isothermal change 0 - DG298, 0.1 = -DV (Peq - 0.1) (at constant T)
NaAlSi3O8 = NaAlSi2O6 + SiO2 P - T phase diagram of the equilibrium curve How do you know which side has which phases? Figure 27-1. Temperature-pressure phase diagram for the reaction: Albite = Jadeite + Quartz calculated using the program TWQ of Berman (1988, 1990, 1991). Winter (2001) An Introduction to Igneous and Metamorphic Petrology. Prentice Hall.
D dP S = Thus D dT V Pick any two points on the equilibrium curve dDG = 0 = DVdP - DSdT Figure 27-1. Temperature-pressure phase diagram for the reaction: Albite = Jadeite + Quartz calculated using the program TWQ of Berman (1988, 1990, 1991). Winter (2001) An Introduction to Igneous and Metamorphic Petrology. Prentice Hall.
Does the liquid or solid have the larger volume? High pressure favors low volume, so which phase should be stable at high P? Does liquid or solid have a higher entropy? Figure 5-2. Schematic P-T phase diagram of a melting reaction. Winter (2001) An Introduction to Igneous and Metamorphic Petrology. Prentice Hall. High temperature favors randomness, so which phase should be stable at higher T? We can thus predict that the slope of solid-liquid equilibrium should be positive and that increased pressure raises the melting point…. Recall decompression melting?
dDG = DVdP - DSdT Does the liquid or solid have the lowest G at point A? What about at point B? Figure 5-2. Schematic P-T phase diagram of a melting reaction. Winter (2001) An Introduction to Igneous and Metamorphic Petrology. Prentice Hall. The phase assemblage with the lowest G under a specific set of conditions is the most stable
Free Energy vs. Temperature dG = VdP - SdT; at constant pressure: dG/dT = -S Because S must be (+), G for a phase decreases as T increases Would the slope for the liquid be steeper or shallower than that for the solid? Figure 5-3. Relationship between Gibbs free energy and temperature for a solid at constant pressure. Teq is the equilibrium temperature. Winter (2001) An Introduction to Igneous and Metamorphic Petrology. Prentice Hall.
Free Energy vs. Temperature Slope of GLiquid > GSolid since SS < SL A: Solid more stable than liquid (low T) B: Liquid more stable than solid (high T) • Slope dP/dT = -S • Slope S < Slope L Equilibrium at Teq • GL = GS Figure 5-3. Relationship between Gibbs free energy and temperature for a solid at constant pressure. Teq is the equilibrium temperature. Winter (2001) An Introduction to Igneous and Metamorphic Petrology. Prentice Hall.
Now consider a reaction, we can then use the equation: dDG = DVdP - DSdT (again ignoring DX) For a reaction of melting (like ice water) • DV is the volume change involved in the reaction (Vwater - Vice) • similarly DS and DG are the entropy and free energy changes dDG is then the change in DG as T and P are varied • DG is (+) for S L at point A (GS < GL) • DG is (-) for S L at point B (GS > GL) • DG = 0 for S L at point x (GS = GL) DG for any reaction = 0 at equilibrium
Free Energy vs. Pressure Figure 5-4. Relationship between Gibbs free energy and pressure for the solid and liquid forms of a substance at constant temperature. Peq is the equilibrium pressure. Winter (2001) An Introduction to Igneous and Metamorphic Petrology. Prentice Hall.
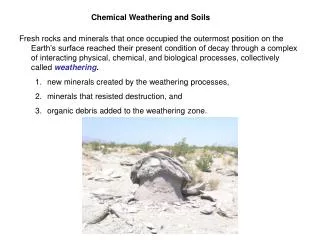
Which species are in solution when microcline weathers to kaolinite? This is a chemical weathering process that can occur on Earth’s surface and in groundwater….
STEP 1: calculate DGoR (appendix B) =[(-906.84)+2(-67.70)+4(-312.66)] - [2(-894.9)+9(-56.687)] = +7.103 kcal STEP 2: calculate K
Equation of a line y=mx+b STEP 3: set up the equilibrium expression STEP 4: take the log of the equilibrium expression STEP 5: collect terms ( ) STEP 6: re-arrange and divide by 2
Any values off this line are not in equilibrium • If log(H4SiO4) > equilibrium reaction moves left so kaolinite becomes microcline. Microcline is stable and • kaolinite is unstable • If log(H4SiO4) < required for equilibrium then kaolinite is • stable and microcline is unstable
May change as reaction proceeds until equilibrium is reached then kaolinite and microcline co-exist in aqueous solution • What if the system is closed with a very low water:rock ratio? • What if the system is open and the water:rock ratio is high? Then the reaction will have a tough time getting to equilibrium so the reaction continues until either kaolinite or microcline is used up and the reaction goes to completion
DH°R = + 14.895 The reaction is endothermic and the reaction consumes heat in the forward direction An increase in temperature favors the conversion of microcline to kaolinite and causes the equilibrium constant to increase…
Using the Van’t Hoff Equation: Where is the equilibrium line at 35°C? Compare KT° to KT: KT° = 10-5.21 Plugging already calculated numbers into the Van’t Hoff eqn: KT = 10-4.85 Since 10-4.85 >10-5.21, equilibrium shifts to the right in favor of kaolinite with increasing T
Stability field for seawater Clay minerals (e.g., kaolinite) deposited in the ocean tend to take up K+ and are converted to illite (musc.) or low-T feldspar (with enough time) Stability field for most natural waters Faure ch. 12, fig. 12.1, p. 174
Phases involved in microcline weathering to kaolinite SiO2 — Al2O3 — K2O — HCl — H2O The system isn’t just kaolinite and microcline How do you know which phases are stable during the reaction? You have to be able to identify ALL of the phases present: gibbsite, muscovite, smectite, pyrophyllite, and amorphous silica… • Understanding Figure 12.1 and log[H4SiO4] • Measuring [K+], [H+] and [H4SiO4] allows stability field to be identified
Complementary mineral stability diagrams Add in Na+ and Ca2+ to look at the stability of albite and anorthite… Ab=albite An=anorthite C=calcite G=gibbsite K=kaolinite Pa=paragonite Py=pyrophyllite Si=amorphous silica