Understanding Value at Risk (VaR) and Its Traditional Methods of Risk Assessment
Value at Risk (VaR) is a traditional risk measure focused on the likelihood of financial loss in investments. Unlike volatility, which can reflect gains as well, VaR answers key questions regarding potential losses at specified confidence levels (95% or 99%). The primary methods for calculating VaR include Historical Simulation, which analyzes past returns to predict future risk, Variance-Covariance, which utilizes the normal distribution of returns to estimate risk, and Monte Carlo Simulation, that uses randomness for comprehensive risk assessment.

Understanding Value at Risk (VaR) and Its Traditional Methods of Risk Assessment
E N D
Presentation Transcript
Traditional Method • The most popular and traditional measure of risk is volatility. • The main problem with volatility, however, is that it does not care about the direction of an investment's movement: a stock can be volatile because it suddenly jumps higher. Of course, investors are not distressed by gains! • For investors, risk is about the odds of losing money, and VAR is based on that common-sense fact. • Question: “How bad can things get?”
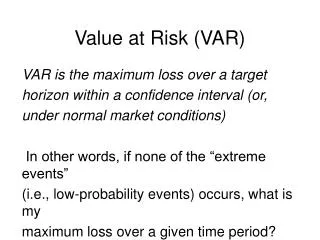
Var Method Value at risk (VAR or sometimes VaR) has been called the "new science of risk management” • VAR answers: a) What is the most I can - with a 95% or 99% level of confidence - expect to lose in dollars over the next month? b) What is the maximum percentage I can - with 95% or 99% confidence - expect to lose over the next year?
Three Methods • Historical Simulation Method • Variance Co-variance Method • MonteCarlo Simulation
Historical Simulation Method • The historical method simply re-organizes actual historical returns, putting them in order from worst to best • It then assumes that history will repeat itself, from a risk perspective • It looks at left tail 5% for possible risk
Historical Simulation The right tail shows that worst 5% return are -4 to -8%. So there is chance of losing at this rate
Variance Co-variance Matrix • This method assumes that stock returns are normally distributed. • it requires that we estimate only two factors - an expected (or average) return and a standard deviation - which allow us to plot a normal distribution curve • And risk is
Variance Co-Variance Matrix • If STD of a stock AAA is 2.64%. . Then according to VCV the risk is