
Analysis of p-FAK and VEGF in HUVEC Cells Treated with CGT at Various Concentrations
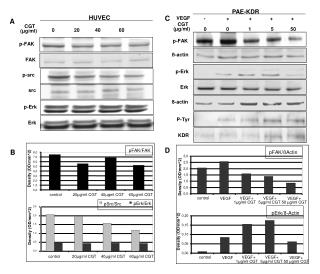
This study investigates the effects of CGT (0, 20, 40, 60 µg/ml) on HUVEC cells, focusing on key signaling molecules such as p-FAK, p-Erk, and p-src in response to VEGF stimulation. The results include the measurement of densities (OD/mm²) and the ratios such as pFAK/FAK and pErk/ß-Actin, providing insights into the mechanistic pathways influenced by CGT and VEGF. The outcomes reveal important interactions that may drive cellular responses in endothelial biology, contributing to the understanding of angiogenesis and related disorders.

Analysis of p-FAK and VEGF in HUVEC Cells Treated with CGT at Various Concentrations
E N D
Presentation Transcript
PAE-KDR C VEGF - + + + + A CGT (µg/ml) CGT (µg/ml) 0 0 1 5 50 0 20 40 60 p-FAK p-FAK HUVEC ß-actin FAK p-Erk p-src Erk src ß-actin p-Erk P-Tyr Erk KDR D B pFAK/FAK 8,0 pFAK/ßActin 3,0 7,0 6,0 2,5 5,0 Density (OD/mm^2) 2,0 4,0 1,5 3,0 Density (OD/mm^2) 2,0 1,0 1,0 0,5 0,0 control 20µg/ml CGT 40µgml CGT 60µg/ml CGT 0,0 VEGF+ VEGF+ control VEGF VEGF+ VEGF+ VEGF+ VEGF+ 1μg/ml CGT 1μg/ml CGT pErk/Erk pSrc/Src 5μg/ml CGT 5μg/ml CGT 50 μg/ml CGT 50 μg/ml CGT 2,5 pErk/ß-Actin 2,0 0,20 1,5 Density (OD/mm^2) 0,15 Density (OD/mm^2) 1,0 0,10 0,5 0,05 0,0 0,00 control 20µg/ml CGT 40µg/ml CGT 60µg/ml CGT control VEGF