Two-Variable Inequalities & Systems of Inequalities
230 likes | 442 Vues
Two-Variable Inequalities & Systems of Inequalities. § 2.7 & 3.3. By the end of today, you should be able to…. Graph and interpret linear and absolute value inequalities. Solve systems of linear inequalities. Two-Variable Inequalities. § 2.7 . Investigation.

Two-Variable Inequalities & Systems of Inequalities
E N D
Presentation Transcript
Two-Variable Inequalities & Systems of Inequalities § 2.7 & 3.3
By the end of today, you should be able to… • Graph and interpret linear and absolute value inequalities. • Solve systems of linear inequalities.
Investigation • Graph the line y = 2x + 3 on graph. • Plot each point listed below and classify them as on the line, above the line, or below the line.(-2,-3), (-2, -1), (-1, -1), (-1, 5), (0, 4), (0, 5), (1, 6), (2, 3), (2, 7) • Are all the points that satisfy the inequality y > 2x + 3 above, below, or on the line?
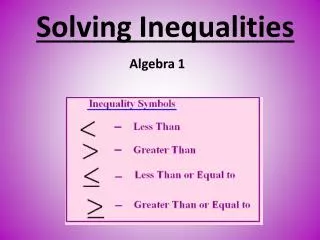
Definitions & Procedures • Linear inequality: an inequality in two variables whose graph is a region of the coordinate plane that is bounded by a line. • To graph: • Graph the boundary line • Decide which side of the line contains solutions to the inequality and whether the boundary line is included.
Identify! Which of the graphs best represents the inequalityx ≥ 2? Which of the graphs best suits the inequalityy < 1?
Which graph best represents the inequalityx – y ≤ -3? Which of the graphs best suits the inequalityy ≤ 5x + 3?
Find which ordered pairs from the given set are part of the solution set for each inequality. 3y + 2x ≤ 8{(-1,5), (3, -1), (5,-1), (9,2)} • x + 2y < -7{(0, 0), (8, -8), (-1, -3), (-5, 3)}
Graph the solution to the given inequality. y ≤ lxl • y < ½x – 3
Absolute Value Inequalities Graph the solution to the given absolute value inequality. -y + 3 > lx +1l – 3 • y ≤ lx – 4l + 5
It takes a librarian 1 minute to renew an old library card and 3 minutes to make a new card. Together, she can spend no more than 30 minutes renewing and making cards. Write an inequality to represent this situation, where xis the number of old cards she renews and yis the number of new cards she makes.
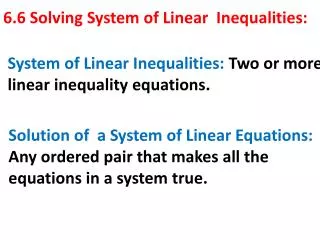
Systems of Inequalities § 3.3
Systems of Inequalities • To graph a system of inequalities, graph each inequality on the same Cartesian grid. • Key concept: Every point in the region of overlap is a solution of both inequalities and is therefore a solution of the system.
Identify! Which of the graphs best represents the following system of linear inequalities: x ≥ 0, y ≥ 0, 4x+ 6y ≤ 12 Write a system of linear inequalities that defines the shaded region.
Examples Tell whether (-3, 3) is a solution of each system.
Examples Solve each system of inequalities by graphing.
Word Problem You want to bake at least 6 and at most 11 loaves of bread for a bake sale. You want at least twice as many loaves of banana bread as nut bread. • Write a system of inequalities to model the situation. • Graph the system.
Word Problem An entrance exam has two parts, a verbal part and a mathematics part. You can score a maximum total of 1600 points. For admission, the school of your choice requires a math score of at least 600. Write and solve a system of inequalities to model scores that meet the school’s requirements.
Student Council is making colored armbands for the football team for an upcoming game. The school's colors are orange and black. After meeting with students and teachers, the following conditions were established: 1. The Council must make at least one black armband but not more than 4 black armbands since the black armbands might be seen as representing defeat. 2. The Council must make no more than 8 orange armbands. 3. Also, the number of black armbands should not exceed the number of orange armbands. Find a feasible region to represent this function