Download
1 / 41
450 likes | 635 Vues
Supply, Demand, and Government Policies. Controls on Prices. Price ceiling A legal maximum on the price at which a good can be sold Usually imposed to appease a particular group of consumers Price floor A legal minimum on the price at which a good can be sold

E N D
Supply, Demand, and Government Policies
Controls on Prices • Price ceiling • A legal maximum on the price at which a good can be sold • Usually imposed to appease a particular group of consumers • Price floor • A legal minimum on the price at which a good can be sold • Usually imposed to help a particular industry (i.e. producers)
Controls on Prices • How price ceilings affect market outcomes • Not binding • If price ceiling above the equilibrium price then no effect on the price or quantity sold • Binding constraint • Below the equilibrium price • Shortage occurs • Sellers must ration the scarce goods • The rationing mechanisms (usually not desirable)
Figure 1 A Market with a Price Ceiling (a) A Price Ceiling That Is Not Binding (b) A Price Ceiling That Is Binding Price of Ice-Cream Cones Price of Ice-Cream Cones Equilibrium price Shortage Price ceiling Price ceiling Equilibrium price $4 $3 3 2 Quantity supplied Quantity demanded Equilibrium quantity Supply Supply Demand 125 100 75 Demand In panel (a), the government imposes a price ceiling of $4. Because the price ceiling is above the equilibrium price of $3, the price ceiling has no effect, and the market can reach the equilibrium of supply and demand. In this equilibrium, quantity supplied and quantity demanded both equal 100 cones. In panel (b), the government imposes a price ceiling of $2. Because the price ceiling is below the equilibrium price of $3, the market price equals $2. At this price, 125 cones are demanded and only 75 are supplied, so there is a shortage of 50 cones. 0 0 Quantity of Ice-Cream Cones Quantity of Ice-Cream Cones
Lines at the gas pump • 1973, OPEC raised the price of crude oil • Reduced the supply of gasoline • Long lines at gas stations • What was responsible for the long gas lines? • OPEC • Shortage of gasoline • U.S. government regulations • Price ceiling on gasoline
Lines at the gas pump • Price ceiling on gasoline • Before OPEC raised the price of crude oil • Equilibrium price was below the price ceiling • No effect on the market • When the price of crude oil rose • Decrease in the supply of gasoline • Equilibrium price – above price ceiling • Binding price ceiling • Severe shortage • Laws regulating the price of gasoline were repealed
Figure 2 The Market for Gasoline with a Price Ceiling (a) The Price Ceiling On Gasoline Is Not Binding (b) The Price Ceiling On Gasoline Is Binding Price of Gasoline Price of Gasoline 3…the price ceiling becomes binding… 2…but when supply falls… 1. Initially, the price ceiling is not binding … 4. …resulting in a shortage Price ceiling Price ceiling P1 P2 P1 S2 Supply, S1 S1 Q1 QD QS Q1 Demand Demand Panel (a) shows the gasoline market when the price ceiling is not binding because the equilibrium price, P1, is below the ceiling. Panel (b) shows the gasoline market after an increase in the price of crude oil (an input into making gasoline) shifts the supply curve to the left from S1 to S2. In an unregulated market, the price would have risen from P1 to P2. The price ceiling, however, prevents this from happening. At the binding price ceiling, consumers are willing to buy QD, but producers of gasoline are willing to sell only QS. The difference between quantity demanded and quantity supplied, QD – QS, measures the gasoline shortage. 0 0 Quantity of Gasoline Quantity of Gasoline
Rent control in the short run and the long run • Price ceiling: rent control • Local government - ceiling on rents • Examples: NYC, Chicago, San Fran, Toronto etc. • Goal: to help the poor afford apartments • Making housing more affordable • Critique • Highly inefficient way to help the poor raise their standard of living
Rent control in the short run and the long run • Adverse effects in the short run • Supply and demand for housing are relatively fixed • Small shortage • Reduced rents • “Unofficial mechanisms” put in place
Rent control in the short run and the long run • Adverse effects in the long run • Supply and demand are more elastic • Landlords (supply) • Are not building new apartments – why bother? • Are failing to maintain existing ones – no incentive when you can’t raise rents • People (demand) • Find their own apartments • Induce more people to move into a city (relatively inexpensive) • Therefore large shortage of housing usually results
Rent control in the short run and the long run • Adverse effects in the long run • Rationing mechanisms • Long waiting lists • Preference to tenants without children • Discriminate on the basis of race • Bribes (“key money”) • People respond to incentives • Free markets • Landlords – clean and safe buildings • Higher prices
Rent control in the short run and the long run • People respond to incentives • Rent control • Shortages & waiting lists • Landlords lose their incentive to respond to tenants’ concerns – why bother? • Tenants get lower rents and lower-quality housing • Landlords try to force tenants out • Policymakers respond with more regulations • Difficult and costly to enforce
Figure 3 Rent Control in the Short Run and in the Long Run (a) Rent Control in the Short Run (supply and demand are inelastic) (b) Rent Control in the Long Run (supply and demand are elastic) Rental Price of Apartment Rental Price of Apartment Shortage Shortage Controlled rent Controlled rent Supply Demand Demand Supply 0 0 Quantity of Apartments Quantity of Apartments Panel (a) shows the short-run effects of rent control: Because the supply and demand for apartments are relatively inelastic, the price ceiling imposed by a rent-control law causes only a small shortage of housing. Panel (b) shows the long-run effects of rent control: Because the supply and demand for apartments are more elastic, rent control causes a large shortage.
Controls on Prices • How price floors affect market outcomes • Not binding if below the equilibrium price • No effect on the market • Binding constraint • Above the equilibrium price • Surplus • Some sellers are unable to sell what they want • The rationing mechanisms – not desirable
Figure 4 A Market with a Price Floor (A) A Price Floor That Is Not Binding (B) A Price Floor That Is Binding Price of Ice-Cream Cone Price of Ice-Cream Cone Surplus Equilibrium price Equilibrium price Price floor Price floor $3 $4 2 3 Quantity demanded Quantity supplied Equilibrium quantity Supply Supply 120 100 80 Demand Demand In panel (a), the government imposes a price floor of $2. Because this is below the equilibrium price of $3, the price floor has no effect. The market price adjusts to balance supply and demand. At the equilibrium, quantity supplied and quantity demanded both equal 100 cones. In panel (b), the government imposes a price floor of $4, which is above the equilibrium price of $3. Therefore, the market price equals $4. Because 120 cones are supplied at this price and only 80 are demanded, there is a surplus of 40 cones. 0 0 Quantity of Ice-Cream Cones Quantity of Ice-Cream Cones
The minimum wage • Price floor: minimum wage • Lowest price for labor that any employer may pay • Fair Labor Standards Act of 1938 • Ensure workers a minimally adequate standard of living • 2009: federal minimum wage = $7.25 per hour • Some states/counties mandate minimum wages above the federal level
The minimum wage • Market for labor • Workers – supply of labor • Firms – demand for labor • If minimum wage is above equilibrium • Unemployment • Higher income for workers who have jobs • Lower income for workers who cannot find jobs
The minimum wage • Impact of the minimum wage • Highly skilled and experienced workers • Not affected, their equilibrium wages are well above the minimum • Minimum wage - not binding • Teenage labor – least skilled and least experienced • Low equilibrium wages • Willing to accept a lower wage in exchange for on-the-job training • Minimum wage – binding
The minimum wage • Teenage labor market • A 10% increase in the minimum wage depresses teenage employment between 1 and 3% • Some teenagers who are still attending high school choose to drop out and take jobs • Displace other teenagers who had already dropped out of school and who now become unemployed
Figure 5 How the Minimum Wage Affects the Labor Market Labor surplus (unemployment) (b) A Labor Market with a Binding Minimum Wage (a) A Free Labor Market Wage Wage Equilibrium wage Minimum wage Labor demand Labor demand Equilibrium employment Quantity demanded Quantity supplied Labor supply Labor supply 0 0 Quantity of Labor Quantity of Labor Panel (a) shows a labor market in which the wage adjusts to balance labor supply and labor demand. Panel (b) shows the impact of a binding minimum wage. Because the minimum wage is a price floor, it causes a surplus: The quantity of labor supplied exceeds the quantity demanded. The result is unemployment.
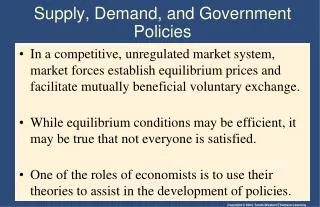
Controls on Prices • Evaluating price controls • Markets are usually a good way to organize economic activity • Economists usually oppose price ceilings and price floors
Controls on Prices • Evaluating price controls • Governments can sometimes improve market outcomes • Govts want to use price controls • Because of unfair market outcome • Aimed at helping the poor • Maybe aim to achieve some other objective • Often hurt those they are trying to help • Other ways of helping those in need • Rent subsidies • Wage subsidies
Taxes • Governments use taxes • To raise revenue for public projects • Tax incidence • Manner in which the burden of a tax is shared among participants in a market • In other words “who pays” • Analysis: assume no tax, then introduce tax to see the “tax incidence”
Tax Incidence Analysis • Tax levied on sellers of a good • Immediate impact on sellers - shift in supply • Supply curve shifts left • Higher equilibrium price • Lower equilibrium quantity • The tax – reduces the size of the market
Figure 6 A Tax on Sellers Equilibrium with tax Tax ($0.50) Price of Ice-Cream Cone A tax on sellers shifts the supply curve upward by the size of the tax ($0.50). Price buyers pay Equilibrium without tax Price without tax $3.30 3.00 2.80 Price sellers receive 100 90 S1 0 Quantity of Ice-Cream Cones When a tax of $0.50 is levied on sellers, the supply curve shifts up by $0.50 from S1 to S2. The equilibrium quantity falls from 100 to 90 cones. The price that buyers pay rises from $3.00 to $3.30. The price that sellers receive (after paying the tax) falls from $3.00 to $2.80. Even though the tax is levied on sellers, buyers and sellers share the burden of the tax. Demand, D1 S2
Tax Incidence Analysis • Tax levied on sellers of a good • Taxes discourage market activity • Buyers and sellers share the burden of tax • Buyers pay more • Worse off • Sellers receive less • Get the higher price but pay the tax • Overall: effective price fall • Worse off
Tax Incidence Analysis • Tax levied on buyers of a good • Initial impact on the demand • Demand curve shifts left • Lower equilibrium price • Lower equilibrium quantity • The tax – reduces the size of the market
Figure 7 A Tax on Buyers Equilibrium with tax A tax on buyers shifts the demand curve downward by the size of the tax ($0.50). Equilibrium without tax Price of Ice-Cream Cone Tax ($0.50) Price buyers pay Price without tax $3.30 2.80 3.00 Price sellers receive 100 90 D2 0 Quantity of Ice-Cream Cones Supply, S1 When a tax of $0.50 is levied on buyers, the demand curve shifts down by $0.50 from D1 to D2. The equilibrium quantity falls from 100 to 90 cones. The price that sellers receive falls from $3.00 to $2.80. The price that buyers pay (including the tax) rises from $3.00 to $3.30. Even though the tax is levied on buyers, buyers and sellers share the burden of the tax. D1
Tax Incidence Analysis • Tax levied on buyers of a good • Buyers and sellers share the burden of tax • Sellers get a lower price • Worse off • Buyers pay a lower market price • Effective price (with tax) rises • Worse off
Tax Incidence Analysis • Taxes levied on sellers and taxes levied on buyers are equivalent • Wedge between the price that buyers pay and the price that sellers receive • The same, regardless of whether the tax is levied on buyers or sellers • Shifts the relative position of the supply and demand curves • Buyers and sellers share the tax burden
Can congress distribute the burden of a payroll tax? • Payroll taxes • Deducted from the amount you earned • By law, the tax burden: • Half of the tax - paid by firms • Out of firm’s revenue • Half of the tax - paid by workers • Deducted from workers’ paychecks
Can congress distribute the burden of a payroll tax? • Tax incidence analysis • Payroll tax = tax on a good • Good = labor • Price = wage • Introduce payroll tax • Wage received by workers falls • Wage paid by firms rises • Workers and firms share the tax burden • Not necessarily fifty-fifty as the legislation requires
Can congress distribute the burden of a payroll tax? • Lawmakers • Can decide whether a tax comes from the buyer’s pocket or from the seller’s • Cannot legislate the true burden of a tax • Tax incidence • Determined by the forces of supply and demand
Figure 8 A Payroll Tax Wage Tax wedge Wage firms pay Wage without tax Wage workers receive Labor supply 0 Quantity of Labor A payroll tax places a wedge between the wage that workers receive and the wage that firms pay. Comparing wages with and without the tax, you can see that workers and firms share the tax burden. This division of the tax burden between workers and firms does not depend on whether the government levies the tax on workers, levies the tax on firms, or divides the tax equally between the two groups. Labor demand
Tax Incidence Analysis • Price responsiveness and tax incidence • Very price-responsive supply and relatively price-unresponsive demand • Sellers – small burden of tax • Buyers – most of the burden • Relatively price unresponsive supply and very price responsive demand • Sellers – most of the tax burden • Buyers – small burden
Figure 9 How the Burden of a Tax Is Divided (a) (a) Price responsive Supply, Price-unresponsive Demand Price 1. When supply is more price responsive than demand . . . 2. . . . The incidence of the tax falls more heavily on consumers . . . Tax 3. . . . Than on producers. Price buyers pay Price without tax Price sellers receive 0 Quantity Supply In panel (a), the supply curve is price responsive, and the demand curve is price-unresponsive. In this case, the price received by sellers falls only slightly, while the price paid by buyers rises substantially. Thus, buyers bear most of the burden of the tax. Demand
Figure 9 How the Burden of a Tax Is Divided (b) (b) Price-unresponsive Supply, Price responsive Demand Price 1. When demand is more price responsive than supply . . . 3. Than on consumers Tax 2. . . . The incidence of the tax falls more heavily on producers. Price buyers pay Price without tax Price sellers receive Demand 0 Quantity Supply In panel (b), the supply curve is price unresponsive, and the demand curve is price responsive. In this case, the price received by sellers falls substantially, while the price paid by buyers rises only slightly. Thus, sellers bear most of the burden of the tax.
Tax Incidence Analyisis • Tax burden • Falls more heavily on the side of the market that is less price responsive • Small price responsiveness of demand • Buyers do not have good alternatives to consuming this good • Small price responsiveness of supply • Sellers do not have good alternatives to producing this good
Who pays the luxury tax? • 1990 - new luxury tax • On yachts, private airplanes, furs, jewelry, expensive cars • Goal: to raise revenue from those who could most easily afford to pay • Luxury items • Demand - quite price responsive • Supply - relatively price-unresponsive
Who pays the luxury tax? • Outcome: • Burden of a tax falls largely on the suppliers • Relatively price-unresponsive supply • 1993: most of the luxury tax was repealed
Tax Incidence Analysis • Price responsiveness and tax incidence • Highly price-responsive demand and supply curves are called “elastic” • Highly price-unresponsive demand and supply curves are called “inelastic”