Download
1 / 14
150 likes | 347 Vues
U.S. Bowling Alley Pricing Strategy. STRT 624- Strategic Pricing December 15, 2010. Michael Friedman Marty Griffith Sarah Lackritz Pierce Reeves. Management Summary. Bowling in the U.S. Venue Classifications Cost and Pricing Structure Study of Nationwide Pricing Conclusions.

E N D
U.S. Bowling Alley Pricing Strategy STRT 624- Strategic PricingDecember 15, 2010 Michael Friedman Marty Griffith Sarah Lackritz Pierce Reeves
Management Summary Bowling in the U.S. Venue Classifications Cost and Pricing Structure Study of Nationwide Pricing Conclusions
Bowling is a popular source of recreation throughout U.S. • Market Share Analysis • AMF – 13.2% • Brunswick – 13.1% • No other company controls >1% • Recent Trends • Revenues have shrunk an average of 2.2% annually since 2005 • Industry profits are correlated with disposal income • Decreased tournament play • Facilities have begun focusing on other segments by increasing the variety of offerings • Recent trend towards consolidation (typical in declining industries) Source: IBIS world- Bowling Alleys in the US Industry Report
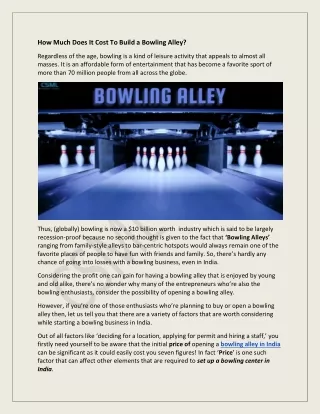
Venue Type Determines Target Market As of 2010: • There are over 4,200 bowling locations nationwide and it is the 7th most popular “recreational pursuit” • The bowling industry generates $3.4B in revenue, with $374M in profits
Best method to evaluate pricing structure is to consider average revenue per bowler outing Key revenue drivers that make up ARPBO: • Lane Rentals (Open play, league play, parties) • Shoe Rentals • Food and Beverage • Games • Billiards • Pinball • Video Games • Pro Shop • Vending • ATM fees • Sublets • FEC’s include variety of other sources
Bowling industry is made up of high fixed costs and low variable costs • The bowling service is almost entirely based on fixed costs • Facility • Lane equipment and maintenance • Bowling equipment • Utilities • Labor costs can be slightly variable based on historical trends of demand for services • The food and beverage service is made up of both fixed and variable costs
Pricing is segmented by time of day/week and promotional pricing is use to achieve higher utilization rates • Segmentation and price discrimination • Day vs. Evening- 3rd degree • Weekday vs. Weekend- 3rd degree • League vs. Open Play-2nd degree • College nights or Senior Rates- 3rd degree • Achieving high utilization rates • Daily specials • Happy hours
How Can We Predict the Price of a Game? • Regression Analysis • Surveyed 58 bowling alleys nationwide • Data from 31 states plus DC • Data collection: • Alley Websites • Phone Calls • Google Maps’ “Search Nearby” feature • Goal: • Use data to determine relationship between price of games and independent variables determined by the team to possibly be significant
Regression analysis relied on data from multiple independent and dependent variables Independent Variables Dependent Variables • Cost of an open play game at different times • All-in cost: 2 games, shoes, and a beer • Type of Venue • Geographic Location • Metro Area (Y/N) • Number of Lanes • Price of Shoes • Price of Domestic Beer • Area Population • Area Median Income • Distance to Nearest Movie Theater • Distance to Closest Bowling Alley • Number of Alleys within 15mi.
There are 4 significant variables affecting weekday open play • Independent Variables: • Type of Venue • Geographic Location- increased price in NE • Metro Area (Y/N) • Number of Lanes • Price of Shoes- Increases Price • Price of Domestic Beer-increases price • Area Population- increases price • Area Median Income • Distance to Nearest Movie Theater • Distance to Closest Bowling Alley • Number of Alleys within 15mi. • Model explains 57% of variability in price
Weekend Open Play: 6 Significant Variables • Independent Variables: • Type of Venue • Lounge type more expensive • Geographic Location • Metro Area (Y/N) • Number of Lanes- decreases price • Price of Shoes- increases price • Price of Domestic Beer- increases price • Area Population- increases price • Area Median Income- increases price • Distance to Nearest Movie Theater • Distance to Closest Bowling Alley Model explains 73% of variability in price Additional variables are significant and greater predictive power
All-in Cost: Fewer Significant Variables • Independent Variables: • Type of Venue • Lounge type $4 more expensive per outing on Weekend nights • Geographic Location • NE $2 more expensive per outing, SE $1.6 & MW $4.8 less expensive • Metro Area (Y/N) • Number of Lanes • Area Population- increases price • Area Median Income- increases price • Distance to Nearest Movie Theater • Distance to Closest Bowling Alley • Number of Alleys within 15mi. Model explains 55% of variability in price price of a beer and shoes are themselves dependant variables and were removed
So… what does this mean? • The models were significant, but not 100% predictive • 25-50% of the price of a game cannot be explained by our model • Other factors were not captured by our model • High fixed cost industries can lead to more variable, and subjective pricing structure • More of the elements we tried to capture had an effect on weekend pricing • Type of venue matters more; customers willing to pay more for up-scale entertainment • Number of lanes also matters; as lanes are added the price of a game goes down, because there is less threat of capacity constraints • Beer and shoes will be more expensive at alleys where games are more expensive • All scenarios showed positive correlations • Possible Future Analysis: Examination of happy hour drink specials • Areas with higher populations pay higher prices
Potential Errors in Research Methodology Room for subjectivity in the following data inputs: type of alley, metro area Census data are accurate, but may not reflect appropriate measure of “area population” or “median income” Sampling errors: biased towards bowling alleys with websites, and towards cities and towns of interest to the researchers Some alleys only rent entire lanes by time period, and making these lanes comparable relies on key assumptions Small sample size: additional data points would make the models more robust