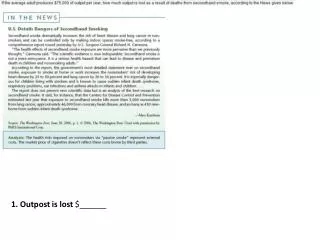
1. Outpost is lost $______
1. Outpost is lost $______. 3. According to the World View given below, which nation had the biggest loss of competitive position in years 2000–2007? Italy Denmark Japan Canada .

1. Outpost is lost $______
E N D
Presentation Transcript
3. According to the World View given below, which nation had the biggest loss of competitive position in years 2000–2007?Italy Denmark Japan Canada
5. Illustrate the following demand on the accompanying graph (This is complete)a) How many pairs will be demanded when the price is $100?________b) How much money will be spent on shoes at a price of $40?$________c) How much money will be spent on shoes at a price of $60?$________
6. What is the opportunity cost (in civilian output) of a defense buildup that raises military spending from 4.0 to 4.4 percent of a $15 trillion economy?$ _______ billion 7. Assume that the product depicted below generates external costs in consumption of $4 per unit. b) What is the socially optimal output?________c) By how much does the market overproduce this good?________ units overproduced
8. a) Assuming a 10 percent sales tax is levied on all consumption, complete the following table: _________ _________ _________ _________ _________ _________ _________ _________b) Is the sales tax progressive or regressive?____________
9. When the size of a factory (and all its associated inputs) doubles and, as a result, output more than doubles: a. The law of diminishing returns must not apply in the smaller factory. b. Economies of scale must exist. c. The short-run ATC curve must be declining. d. Marginal costs must be declining.11. Suppose the following data represent the market demand for college education:a) If tuition is set at $4,000, how many students will enroll? _______ millionc) What is the socially optimal level of enrollments at the same tuition price of $4,000?________milliond) How large of a subsidy per student is needed to achieve this optimal outcome?$ ___________
12. Diseconomies of scale are reflected in: A. The downward-sloping segment of the long-run average total cost curve. B. The downward-sloping segment of the long-run marginal cost curve. C. A downward shift of the long-run average total cost curve. D. The upward-sloping segment of the long-run average total cost curve.13. Complete the following cost schedule _____ ______ ______ _______ _____ ______ ______ _______ _____ ______ ______ _______ _____ ______ ______ _______ _____ ______ ______ _______c) At what output rate is ATC minimized?______Units
14. Use the following dataPrice $ 1 2 3 4 5 6 7 8 9 10 Quantity 20 21 19 17 15 13 11 9 7 5a) At what price is total revenue maximized?$________b) At that price what is the elasticity of demand?_________ c) Between what prices is demand elastic?Between $ (either 6 or 1) _______ and (either 10 or 15) $ ______.15. Which of the following is a long-run concept? a. Diminishing marginal productivity b. Diminishing returns c. Diseconomies of scale d. Fixed costs
16. The average variable cost curve slopes upward with a higher rate of output in the short run because of: A. The effect of diminishing returns.B. The shape of the average fixed cost curve. C. Diseconomies of scale. D. Implicit but not explicit costs. 17. Diminishing returns occur because of: A. Inefficiency in the production process. B. The use of inferior factors of production. C. A rising ratio of variable input to fixed input. D. Lower opportunity costs of the factors of production.18. Economies of scale are reductions in average: A. Total cost that result from declining average fixed costs. B. Fixed cost that result from reducing the firm's scale of operations. C. Total cost that result from using operations of larger size. D. Fixed cost resulting from improved technology and production efficiency.
19. According to the figure given below, which of the following changed as a result of Katrina damage (answer yes or no)(a) Demand: _______(b) Quantity demanded: _____(c) Price: ______
20. The most desirable rate of output for a firm is the output that:A. Minimizes total costs. B. Maximizes total profit. C. Minimizes marginal costs. D. Maximizes total revenue.21. Based on the News given below, what is the ATC per dollar of sales at a: a) Large funeral home? ______cents b) Small funeral home? ______cents
22. If the marginal cost curve is rising, then which of the following must be true? A. The average total cost curve must be rising B. The average total cost curve must be below the marginal cost curve C. The average total cost curve must be above the marginal cost curve D. Total costs must be rising23. The marginal cost curve intersects the minimum of the curve representing:A. TCB. ATCC. AFCD. MPP24. a) According to the figure given below, what is the opportunity cost of North Korea’s military force at point N? A. CG Food B. AC Food C. OC Food b) How much more food could North Korea produce if it cut military output from OD to OH ? A. CG Food B. AC Food C. OC Food
25. Use the following data to draw supply and demand curve on the accompanying graph.a) What is the equilibrium price?$ __________b) If a minimum price (price floor) of $6 is set, (i) what kind of disequilibrium results?A. shortagesB. surplus (ii) How large is it? _________ unitsc) If a maximum price (price ceiling) of $3 is set, (i) What disequilibrium results? A. shortages B. surplus (ii) How large is it ? _________units26. Labor productivity will increase in response to: A. Lower wages. B. An increase in the amount of capital per worker. C. Higher resource costs. D. An increase in diminishing returns.
27. A production function shows the: A. Minimum amount of output that can be obtained from alternative combinations of inputs. B. Maximum quantity of inputs required to produce a given quantity of output. C. Maximum output that can be produced with varying combinations of factor inputs. D. Output capacity of the entire economy.28. Economies of scale: A. Exist in both the short run and the long run. B. Explain why average variable and average total costs decline in the short run. C. Explain why average total costs decline as output increases in the long run. D. Explain why average total costs increase as output increases in the long run.
29. According to the following figures, what would the new equilibrium price of tutoring services be if Ann decided to stop tutoring? ___________ See next page for the rest of the figures.
30. Suppose (A) the hourly wage rate is $18 in the United States and $1 in China, and (B) productivity is 20 units per hour in the U.S. and 1 unit per hour in China. What are unit labor costs ina) The United States?$ __________ per unitb) China?$ __________per unit 31. The period in which at least one input is fixed in quantity is the: A. Long run. B. Production run. C. Short run. D. Investment decision.32. If a new home can be constructed for $150,000, what is the opportunity cost of federal defense spending, measured in terms of private housing? (Assume a defense budget of $600 billion.)_________ homes
34. Suppose (A) the hourly wage rate is $20 in the United States and $3 in China, and (B) productivity is 15 units per hour in the U.S. and 1 unit per hour in China. What are unit labor costs ina) The United States?$ ________ per unitb) China?$ ________ per unit36. A U-shaped average total cost curve implies: A. First, diminishing returns, and then, increasing returns. B. First, marginal cost below average total cost, and then marginal cost above average total cost. C. That total costs are at a minimum at the minimum of the average cost curve. D. A linear total cost curve.
35. According to the following figure, at what price would Tom buy 9 hours of Web tutoring? a) Without a lottery win.$ _________/hourb) With a lottery win.$_______/hour
37. Suppose the following data represent the prices that each of three consumers is willing to pay for snowplowing a) Construct the market demand curve for snowplowing on the graph.<---------- Click and drag into Graph b) If the market price of snowplowing were $40, how many units would be demanded? ____________ c) Now suppose that this is a public good, in the sense that all consumers receive satisfaction from the good even if only one person buys it. Under these conditions, what is the social value of thei) First unit? ii) Second unit? $ ___________ $ _____________
38. Profit is: A. The difference between total cost and variable cost. B. The difference between total revenue and total cost. C. Earned at all points along the production function. D. Only possible with technical efficiency.39. The goal of the price incentives described in the News below, is to (select one):A. Increase supply. B. Increase quantity supplied. C. Increase demand. D. Increase quantity demanded.
40. Ceteris paribus, the law of diminishing returns states that beyond some point, the: A. Returns on stocks and bonds diminish with higher security prices. B. Addition to total utility diminishes as more units of a good are consumed. C. Marginal physical product of a factor of production diminishes as more of that factor is used. D. Output of any good increases as more of a variable input is used.42. The average fixed cost (AFC) curve: A. Is U-shaped as a result of diminishing returns. B. Declines as long as output increases. C. Is intersected at its minimum point by marginal cost. D. Intersects the marginal cost curve at its minimum point.43. Intel's chief executive says the company might expand the technology it is using in its planned $2.5 billion chip-manufacturing factory in China if the U.S. government allows it, underscoring the technology giant's ambitions in the world's fourth-biggest economy. The Intel executive is making a A. Long run decision, therefore an investment decision. B. Long run decision, therefore a production decision. C. Decision that would definitely increase costs. D. Decision that would cause ATC to increase.
Use the following information to answer the question(s) below:According to the above table, how fast does total output have to grow in order to raise per capita GDP in 47. Canada? A. More than 0.1% B. More than 1.3% C. More than 0.5% D. More than 1% 48. Madagascar? A. More than 1.8% B. More than 2.8% C. More than 0.6% D. More than 3.5%
Use the following information to answer the question(s) below: If Haiti’s per capita GDP of roughly $1,150 were to increase as fast as Niger's (refer table above), what would its per capita GDP be in 49. 20 Years $_________50. 30 Years $ _________
51-54 Given the above data on gasoline supply and demand (a) What is the equilibrium price?_____Per gallon(b) How large a market shortage would exist if government set a price ceiling of $1 per gallon?_____gallons(a) What is the equilibrium price?_______ Per gallon(b) How large a market shortage would exist if government set a price ceiling of $1 per gallon?_______Gallons
55.How many people die in the market-driven economy? A. qd - qEB. qa – QeC. qd - qa56.How many people die in the government-regulated economy? A. qd – qa B. qa – qE C. qd - qE 57. How many people die in the market-driven economy? A. qd - qEB. qa – qE C. qd - qa 58.How many people die in the government-regulated economy? A. qd - qaB. qa - qEC. qd - qE
59.The quantity of organs demanded increase? qE to qdqd to qaqa to qEremains the same 60. The demand increase? qE to qdqa to qEqd to qaremains the same 61.The quantity of organs supplied decrease? qE to qaqd to qE.qd to qa. remains the same 62.The supply decrease? qE to qaqd to qEqd to qaremains the same 63.The quantity of organs demanded increase? qE to qdqd to qaqa to qE remains the same 64.The demand increase? qE to qdqa to qEqd to qa remains the same 65.The quantity of organs supplied decrease? qE to qaqd to qE. qd to qa. remains the same 66.The supply decrease? qE to qaqd to qEqd to qa remains the same
a) Overproducing private goods? V - W V - R S - R b) Under producing public goods? S - R R - V W - R
a) The market value of the good?$ ______ / unit b) The social value of the good?$ _______ / unit
a) A poor family with income of $18,000 per year?_______ % b) An affluent family with income of $40,000 per year?_______ %
76-78Suppose a company incurs the following costs: labor, $750; equipment, $325; and materials, $175. The company owns the building, so it doesn’t have to pay the usual $1,500 in rent. a) What is the total accounting cost?b) What is the total economic cost?c) If the company sold the building and then leased it back, what would be the change in a) Accounting costs? (Select one) Decrease to _______ Increase to _______ No Change b) Economic costs? (Select one) Decrease to _______ Increase to _______ No Change
79-82At 4 units of output in Table 20.4, total fixed costs are: $78.00. $19.50. $16.00. $20.00. The marginal cost of the fourth unit of output in Table 20.4 is: $4.00. $20.00. $16.00. $19.50. At 2 units of output in Table 20.4, the average variable cost is: $13. $6. $12. $21. At 4 units of output in Table 20.4, the total variable cost is: $5.00. $20.00. $19.50. $62.00.
82-85At 3 units of output in Table 20.4, average fixed costs are: $16.00. $19.50. $5.33. $15.50. For the output levels in Table 20.4, the minimum of the average total cost curve occurs at a production rate of: 2 units per day. 3 units per day. 4 units per day.Zero units per day For the output levels in Table 20.4, the minimum of the average variable cost curve occurs at a production rate of: 3 units per day. 2 units per day. 4 units per day. Zero units per day.