CIE colorimetry
CIE colorimetry. The colour equation Condition 1 : 2° bipartite visual field, central fixation and dark surround. Matching (reference, primary) stimuli: Red (R): 700 nm, Green (G): 546,1 nm and Blue (B): 435,8 nm. Colour matching experiment. CIE colorimetry. The colour equation

CIE colorimetry
E N D
Presentation Transcript
CIE colorimetry • The colour equation • Condition 1: 2° bipartite visual field, central fixation and dark surround. • Matching (reference, primary) stimuli: Red (R): 700 nm, Green (G): 546,1 nm and Blue (B): 435,8 nm
CIE colorimetry • The colour equation • Condition 2: Magnitude of the Matching Stimuli: The units of the three primaries provide a colour match with an equienergetic white test stimulus:
But i.e.: The colour equation
Additivity: Complex spectrum • or as integrals
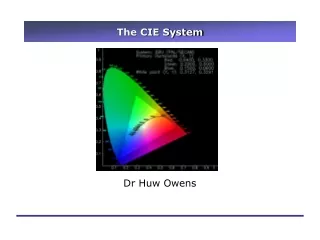
X,Y,Z colour space • CIE 1931 Standard Colorimetric Observer
Chromaticity diagram • E: equi-energy chromaticity • R, G, B: chromaticity of real primaries
Mixing and visualising colours in the chromaticity diagram • achromatic (N for neutral) "white point” • dominant (complementary) wavelength (lD), correlate of hue • excitation purity, correlate of saturation
Excitation purity • For chromaticity point C
Description of a colour stimulus • Tristimulus values, X, Y, Z. • Chromaticity and luminance: Y (or L), x, y. • Further descriptors: • Luminance: L, • dominant (or complementary) wavelength:lD • excitation purity: pe
Additive mixture of two stimuli • X = aRXR + aGXG ; • Y = aRYR + aGYG ; • Z = aRZR + aGZG • .
CIE 1964 Standard Colorimetric Observer • Macula lutea or yellow spot • 10° filed of vision • . • .
MacAdam ellipses • The CIE x,y diagram with ellipses representing small colour differences
The CIE system of colorimetry • CIE 1976 uniform chromaticity diagram • colour temperature, Tc & correlated Tc, TCC • Colorimetry of surface colours • CIE standard illuminants and sources • CIE colour spaces • CIELUV space • CIELAB space • CIE 1994 colour difference • Brightness - luminance ratio
Uniform colour scales • u' = 4X / (X+15Y+3Z) = 4x / (-2x+12y+3) • v' = 9Y / (X+15Y+3Z) = 9y / (-2x+12y+3) • u = u' , v = (2/3)v' • CIE 1976 u,v hue angle: • huv= arctg[(v' - v'n) / (u' - u'n)] = v* / u* • The CIE 1976 u,v saturation: • suv = 13[(u' - u'n)2 + (v' - v'n)2]1/2
Colour temperature - 1 • The spectral power distribution of a full radiator can be calculated using Planck's formula: • Me = c1-5[exp(c2/T)-1]-1 • c2 = 1,4388x10⁻² mK
Colorimetry of surface colours • radiance factor b(l) • tristimulus values:
CIE Standard sources and illuminants - 1 • CIE Standard Illuminant A: An illuminant having the same relative spectral power distribution as a Planckian radiator at a temperature of 2856 K • CIE Standard Illuminant C: An illuminant representing average daylight with a correlated colour temperature of about 6800 K. (This illuminant is now obsolete.)
CIE Standard sources and illuminants - 2, daylight illuminants • for correlated colour temperatures from approximately 4000 K to 7000K:
CIE Standard sources and illuminants - 3, daylight illuminants • for correlated colour temperatures from 7000K to approximately 25 000 K
CIE Standard sources and illuminants - 4, daylight illuminants • S(l) = S0(l) + M1S1(l) + M2S2(l)
CIE Standard sources and illuminants - 5, daylight illuminants • CIE Standard Illuminant D65: An illuminant representing a phase of daylight with a correlated colour temperature of approximately 6500 K • CIE Illuminants: Fluorescent lamps
Correlated colour temperature • Iso-temperature lines (in u,v-diagram)
Different temperature concepts • Real temperature • Radiant temperature • Distribution temperature • Colour temperature • Correlated colour temperature
Further recommendations on surface colour measurement • Standard of reflectance factor: • perfect reflecting diffuser • secondary reference reflectance factor • pressed barium sulphate plate • “ halon" white standards • Standard measuring geometry • 45°/normal reflectance factor • diffuse/normal, specular included/excluded: reflectance factor • normal/diffuse, specular included/excluded: reflectance
CIE 1976 (L*a*b*) colour space, CIELAB colour space • L* 116(Y/Yn)1/3 - 16 • a* 500 ( X/Xn)1/3 - (Y/Yn)1/3 • b* 200 (Y/Yn)1/3 - (Z/Zn)1/3 • for X/Xn > 0,008856 • Y/Yn > 0,008856 • Z/Zn > 0,008856
CIE 1976 a,b colour difference and CIELAB components • Colour difference: • Eab (L*)2 + (a*)2 + (b*)21/2 • CIE1976 a,b chroma: • Cab* (a*2 + b*2)1/2 • CIE 1976 a,b hue-angle: • ha arctan (b*/a*) • CIE 1976 a,b hue-difference: • Hab* (Eab*)2 - (L*)2 - (Cab*)21/2
CIE 1994 colour difference • k parametric factors, industry dependent • S weighting functions, depend on location in colour space:
2.2 Reference conditions Reference conditions describe a set of experimental and material variables that are typical of the conditions used in developing visual colour-difference data sets for object colours. The reference conditions may not have been universally employed in all data sets used by CIE TC1-47 in developing and testing the recommended model but they represent common levels of the experimental variables. The reference conditions are:
CIE 2000 colour difference equation 2.2 Reference conditions Reference conditions describe a set of experimental and material variables that are typical of the conditions used in developing visual colour-difference data sets for object colours. The reference conditions may not have been universally employed in all data sets used by CIE TC1-47 in developing and testing the recommended model but they represent common levels of the experimental variables. The reference conditions are:
Reference conditions Illumination: source simulating the spectral relative irradiance of CIE Standard IlluminantD65. Illuminance: 1000 lx. Observer: normal colour vision. Background field: uniform, neutral gray with L* = 50. Viewing mode: object. Sample size: greater than 4 degrees subtended visual angle. Sample separation: minimum sample separation achieved by placing the sample pair indirect edge contact. Sample colour-difference magnitude: 0 to 5 CIELAB units. Sample structure: homogeneous colour without visually apparent pattern or non-uniformity.
Notes • Deviations from the reference conditions can affect the performance of the colour-differencemodel. • Changes in viewing and illuminating conditions affect the validity of CIELAB as a colourspace and further necessitate the definition of parametric factors. • Changes in the sourcecorrelated colour temperature from 6500 K affect the accuracy of the chromatic adaptationtransformation embedded in CIELAB, i. e. X/Xn, Y/Yn, and Z/Zn. • Illuminance levels much lowerthan 1000 lux result in reduced discrimination. With an increase in the angle subtended by thecolour-difference pair, the influence of background lightness on colour discriminationdecreases.
Modification of the a* (red-green opponent) axis The CIE 1976 (L*a*b*) colour space (CIE, 1986) is retained as an approximate uniform colourspace representing perceptual colour magnitudes in terms of opponent colour scales with a localized modification to the a* (red-green opponent) axis. This modification was made toimprove agreement with visual colour-difference-perception for neutral colours. Themodification increases the magnitudes of a’ values compared to a* values for colours at lowchroma. At higher chroma the modified a’ value approaches the conventional a* value.Quantities L’ and b’ are defined as equal to L* and b* respectively. Primed quantities in thisreport refer to quantities derived from L’, a’, b’ coordinates.
Modification of the a* (red-green opponent) axis • L’=L* • a’ = a*(1 + G) • b’ = b* • where G depends on mean C* value of the two samples • Modified chroma and hue angle are calculated using the a’, b’ coordinates, but should not be used in colour space calculaqtions
Total colour-difference • A perceived visual colour-difference magnitude, DeltaV, is related to the total colour difference, DeltaE00, through an overall sensitivity factor, kE. • Delta V = kE-1Delta E00
Total colour difference The total colour-difference between two colour samples with lightness, chroma and hue differences, with weighting functions, SL, SC, SH, parametric factors, kL, kC, kH and rotation function is determined similarly as CIE94 including this rotation factor
Rotation function Visual colour-difference perception data show an interaction between chroma difference andhue difference in the blue region. The interaction results in a significant tilt of the major axis ofthe colour-difference ellipse. The ellipse tilt is in the counter-clockwise direction and away fromthe direction of constant hue angle. To account for this effect, a rotation function is applied toweighted hue and chroma differences. The rotation function has a significant effect only for the blue high chroma region of the a’, b’ plane.