Debugging Logic Errors
Debugging Logic Errors. CPS120 Introduction to Computer Science Lecture 6. Compiling and Debugging. Executable code will not be created until you correct all of the syntax errors in your source code Then the fun (with logic errors ) begins. Syntax & Logic Errors.

Debugging Logic Errors
E N D
Presentation Transcript
Debugging Logic Errors CPS120 Introduction to Computer Science Lecture 6
Compiling and Debugging • Executable code will not be created until you correct all of the syntax errors in your source code • Then the fun (with logic errors) begins
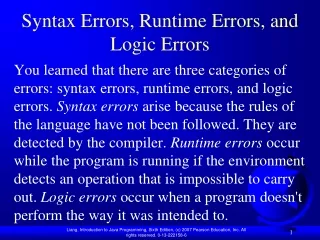
Syntax & Logic Errors • A syntax error is simply the violation of the rules of a language; misuse of structure and form in programming or a violation of the compiler’s rules. These errors are detected by the compiler • Alogic erroris a mistake that complies with the rules of the compiler that causes the program to generate incorrect output
Semantic Errors • A semantic error is a violation of the rules of meaning of a programming language • E.g. My refrigerator just drove a car to Chicago • Overt logic errors • Something is obviously wrong even though the program is running • Convert logic errors • Not so obvious something is wrong Run things various ways to highlight these errors
It Did What?? • If the data is good and a program does not do what it is supposed to do, there must be at least one logic error present • The syntax rules of C++ have been correctly followed, but the meaning of the code is incorrect
Approaches to Correction • Desk-checking • Inserting Tracing Statements • Used when program "crashes" • Runs to completion with incorrect output • Using an interactive debugger
Common Semantic Errors • Infinite Loop • Created when a loop in which the expression tested never becomes false • Misunderstanding operator precedence • Dangling else • Off-By-One Error • Loop that iterates one fewer or one more than is correct • Code inside a loop that doesn’t belong there • Not using a compound statement when one is required • Array index bounds error
Infinite Loop char response; cout << “Please enter (y)es or (n)o ->”; cin >> response; while ((response !=‘y’)||(response !=‘n’)) { cout << “Please try again. Enter (y)es or (n)o ->’;
Misunderstanding Operator Precedence milesPerGallon = endMileage – startMileage /gallonsUsed; • Division has a higher precedence than subtraction Should be milesPerGallon = (endMileage –startMileage) / gallonsUsed;
Dangling ELSE If (relative) if (my friend) cout << “both“; else cout << “neither”; • When this code is run, it prints “both” correctly when both bool variables are true • If both are false, nothing prints • If relative is true but friend is false, it prints neither
Off-by-one Error • A loop iterates one fewer or one more than is correct cont int NUM_VALUES = 50; int lcv,someValue, total=o; for (lcv=1; lcv < NUM_VLUES; lcv++) { cout << “Enter an integer ->”; cin >> someValue; total = total + someValue; }
Bad Code Inside a Loop for (lcv = 1; lcv <= Num_VALUES; lcv++) { cout <<“Enter an integer ->”; cin >> someValue; total = total + somevalue; average = total / NUM_VALUES; cout << "Total is: " << total << endl; cout << " Average is: " << average; }
Missing Compound Statement char ch; infile.get (ch); while (infile) cout<< ch; infile.get (ch); • Should be { cout << ch; infile.get (ch); }
Array Index Bounds Error const int NUM_DAYS = 7; int temperatures[NUM_DAYS]; int count; for (count =1;count <= NUM_DAYS; count++ { cout << Enter a temperature: “; cin >> temperatures [count]; } • This code contains a fundamental error – the array’s correct indices range from0 through 6, while the array indices used in the for loop range from 1 to 7
Tracing Statements • Inserting print statements to display the current status of critical variables, i.e. those being modified //Debug trace statement cout << endl << "Location 1:" << endl << "Highest values is:" << highest_value << "Lowest value is:" << lowest_value << endl << "Sum of positives is:" << sum_pos_values << "Sum of negatives is:" << sum_neg_values << endl << "Mean of positives is:" << mean_pos_values << "Mean of negatives is:" << mean_neg_values << endl << endl;
Tracing Decisions • What to display • Variables modified in the block of code • Where to place the displays • At logical breakpoints • Before and after IF…ELSE • Before and after LOOPS and when counters are incremented • At the end of 15 or 20 sequential statements
ASSERT Macro • Stops a program midstream during debugging • Cannot resume • Cannot examine variables • Allows you to stop a program when a specific condition occurs • Multiple asserts can be used in the same code • assert (<expression>); • If the expression is true (has a non-zero value), the program continues. If false (has a zero value), execution terminates with an error message that the assert failed • Requires: #include <cassert.h1>
Interactive (Step) Debugger • One of he best tools for uncovering logic errors and for testing to make sure the problems are non-existent is the step debugger in the Visual C++ programming environment • Allows programmers to execute their code one line at a time • Allows you to look at the values of variables during the pause • Will not help with syntax problems, since it requires an executable to work
Interactive Debugging • Discover critical points by stopping execution and taking a snapshot of the program's activity • Resume activity • Check values of critical variables • Observe the 'flow of control ' • Run one statement at a time or in groups • Order of execution • Dangling ELSEs, missing subroutine calls, infinite loops
The Step Debugging Process • Start out in the Visual C++ editor window • Click on BUILD, SET ACTIVE CONFIGURATIONS, WIN 32 DEBUG • Click on the BUILD menu, START DEBUG and STEP INTO your program • This will start the program but only execute the first line
Debugging View • Program Pane – displays source • Has current statement indicator • Variables Pane – displays list of variables that are defined • Lower Left • Watch Pane – drag variables and expressions there to see monitor their content • Lower Right • Call Chain (Stack trace)
Stepping Options • In the DEBUG window, you have several options: • GO (F5): Use this option when you have set some breakpoints in the program and you want to get to them or between them quickly • STEP COMMANDS: Executes one statement. • STEP INTO (F11): Tells the program to enter a function or other command instead of just processing • STEP OVER (F10): Won’t keep a line from executing, just steps over it • STEP OUT (Shift-F11): Returns control to the portion of the code that called a function • RUN TO CURSOR (CNTL-F10): Will run the program to wherever the programmer places the cursor in a program
Inserting & Removing Breakpoints • Before you use the step debugger, you may want to review the source code and try to determine the general area where errors are occurring. This is done by setting breakpoints • This allows you to get to interesting sections of code • Breakpoints have no impact on your program, other than how it executes • Click on the "hand" (breakpoint) button to set or remove breakpoints • Breaks must be in executable statements
Watching Variables • Use the WATCH window pane in the lower right corner of the debugger screen to check the value of a variable • Right click and check properties to see variable types • A variable can also be verifiedat a breakpoint by using QUICKWATCH or you can add it to the WATCH pane • Change the value of a variable by double-clicking on it in the variables pane
Functions • There is a pop-up menu for switching functions above the program pane
Arrays, Structs and Classes • A + next to a name in the variable pane will show all the values of a structured variable
Preferences • Alterable from the TOOLS / OPTIONS menu
Program Testing • Sampling: Testing some of the functions of software and making inferences on the rest of the functionality based on these observations • Population Testing: Testing every possible option before software is considered complete
Step Debugger • One of he bet tools for uncovering logic errors and for testing to make sure the problems are non-existent is the step debugger in the Visual C++ programming environment • Allows programmers to execute their code one line at a time • Allows you to look at the values of variables during the pause • Will not help with syntax problems, since it requires an executable to work
The Step Debugging Process • If the data is good and a program does not do what it is supposed to do, there must be at least one logic error present • Start out in the Visual C++ editor window • Click on the BUILD menu, START DEBUG and STEP INTO your program • This will start the program but only execute the first line
Stepping Options • In the DEBUG window, you have several options: • GO (F5): Use this option when you have set some breakpoints in the program and you want to get to them or between them quickly • STEP INTO (F11): Tells the program to enter a function or other command instead of just processing • STEP OVER (F10): Won’t keep a line from executing, just steps over it • STEP OUT (Shift-F11): Returns control to the portion of the code that called a function • RUN TO CURSOR (CNTL-F10): Will run the program to wherever the programmer places the cursor in a program
Inserting & Removing Breakpoints • Before you use the step debugger, you may want to review the source code and try to determine the general area where errors are occurring. This is done by setting breakpoints • This allows you to get to interesting sections of code • Breakpoints have no impact on your program, other than how it executes • Click on the hand (breakpoint) button to set or remove breakpoints
Watching Variables • Use the WATCH window pane in the lower right corner of the debugger screen to check the value of a variable • A variable can also be verified at a breakpoint by using QUICKWATCH or you can add it to the WATCH pane
Program Testing • Sampling: Testing some of the functions of software and making inferences on the rest of the functionality based on these observations • Population Testing: Testing every possible option before software is considered complete