Download
1 / 34
340 likes | 366 Vues
This report summarizes the financial performance of the company for the six-month period ending on October 31, 2009, highlighting revenue growth, operating profit, and earnings per share. The report also provides an overview of the performance of the UK Bus, North America, UK Rail, and Virgin Rail Group divisions. The company's ability to withstand economic conditions and benefit from a recovery is emphasized.

E N D
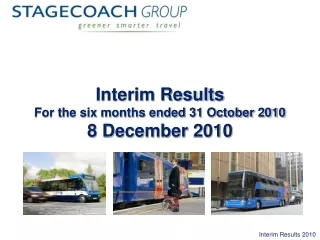
Interim ResultsFor the six months ended 31 October 20099 December 2009
Definitions • Like-for-like amounts are derived, on a constant currency basis, by comparing the relevant year-to-date amount with the equivalent prior year period for those businesses and individual operating units that have been part of the Group throughout both periods. • Operating profit for a particular business unit or division within the Group refers to profit before net finance income/charges, taxation, intangible asset expenses, exceptional items and restructuring costs. • Operating margin for a particular business unit or division within the Group means operating profit as a percentage of revenue. • Exceptional items means items which individually or, if of a similar type, in aggregate need to be disclosed by virtue of their nature, size or incidence in order to allow a proper understanding of the underlying financial performance of the Group. • Net debt is the net of cash and borrowings as reported on the consolidated balance sheet, adjusted to exclude any accrued interest and deferred gains on derivatives.
Highlights • Revenue growth in core UK divisions • Interim dividend of 2.0p, up 11.1% • Adjusted earnings per ordinary share down 25.6% • Reduced rail profit reflecting economic conditions • Above-inflation increases in fuel and pensions costs and significant premia payments to Government • Business is well placed to benefit from a recovery in economic conditions
Financial summary 31 Oct 09 31 Oct 08 Change Revenue - continuing operations Operating profit* - continuing operations Adjusted earnings per ordinary share* Basic earnings per ordinary share Net debt Dividend per ordinary share £1,081.4m £93.5m 9.0p 8.5p £(343.1)m 2.0p £1,045.0m £119.8m 12.1p 9.7p £(370.2)m 1.8p 3.5% (22.0)% (25.6)% (12.4)% (7.3)% 11.1% * Excluding exceptional items and intangible asset expenses
Summary income statement 31 Oct 09 £m 31 Oct 08 £m Change £m UK Bus operating profit North America operating profit excl megabus megabus North America operating loss UK Rail operating profit Share of joint ventures’ profit after tax Restructuring and group overheads Finance charges (net) Tax Profit excluding intangibles and exceptionals Intangibles and exceptionals, net of tax Reported profit from continuing operations 58.9 9.0 (0.7) 14.9 17.6 (6.2) (18.0) (11.1) 64.4 (7.7) 56.7 60.9 20.2 (0.4) 31.7 15.6 (8.2) (14.6) (18.9) 86.3 (16.9) 69.4 (2.0) (11.2) (0.3) (16.8) 2.0 2.0 (3.4) 7.8 (21.9) 9.2 (12.7)
UK Bus 31 Oct 09 31 Oct 08 Change Revenue (£m) Like-for-like revenue (£m) Operating profit (£m) Operating margin Estimated like-for-like passenger journeys (m) Like-for-like vehicle miles operated (m) 433.0 417.3 58.9 13.6% 329.4 163.2 410.4 399.9 60.9 14.8% 331.7 163.5 5.5% 4.4% (3.3)% (1.2)% (0.7)% (0.2)% • Continued underlying revenue growth • £8.6m increase in fuel costs and £4.0m increase in pension costs • Expected reduction in fuel costs in 2010/11 • Flexible business model • OFT market review
North America 6 months to 31 October 2009 6 months to 31 October 2008 Revenue US$m Operating Profit US$m Operating Margin % Revenue US$m Operating Profit US$m Operating Margin % Wholly-owned, excluding megabus.com Share of Twin America Total excl. megabus.com megabus.com Total 201.3 41.0 242.3 20.1 262.4 14.6 12.8 27.4 (1.1) 26.3 7.3% 31.2% 11.3% (5.5)% 10.0% 267.7* Nil 267.7 15.4 283.1 38.0 Nil 38.0 (0.8) 37.2 14.2% n/a 14.2% (5.2)% 13.1% • Excluding megabus, revenue down US$25.4m but costs down US$14.8m notwithstanding higher fuel cost per unit • Like-for-like revenue down 6.5% • Decisive action to reduce operating mileage and costs • Twin America joint venture performing to plan • US$12.5m dividends received • Expansion of megabus.com * Includes US$47.5m for business transferred to Twin America from 31 March 2009
UK Rail (wholly-owned) 31 Oct 09 31 Oct 08 Change Revenue (£m) Revenue excluding light rail (£m) Operating profit (£m) Operating margin South Western Trains estimated passenger miles (millions) East Midlands Trains estimated passenger miles (millions) 512.9 475.0 14.9 2.9% 1,635.6 577.0 486.4 466.1 31.7 6.5% 1,675.6 615.7 5.4% 1.9% (53.0)% (3.6)% (2.4)% (6.3)% • Continued revenue growth • Increased payment to/decreased subsidy from Department for Transport • Significant cost savings • Additional revenue from special projects at Manchester Metrolink • SWT disputes hearing in February 2010 – decision by April 2010
Virgin Rail Group 31 Oct 09 31 Oct 08 Change Revenue - 49% share (£m) Operating profit - 49% share (£m) Operating margin Dividends received (£m) Estimated Passenger miles (millions) - West Coast 170.4 12.8 7.5% 8.6 1,669.7 159.3 19.4 12.2% 19.4 1,378.0 7.0% (34.0)% (4.7)% (55.7)% 21.2% • Number of services increased by approximately one-third from December 2008 • Improvements in reliability of railway infrastructure • Step-up in infrastructure costs • Profit supported by revenue support
Miscellaneous income statement items 31 Oct 09 31 Oct 08 Change Citylink joint venture (£m) Splash Tours joint venture (£m) Intangible asset expenses (£m) Group overheads (£m) Restructuring costs (£m) Post-tax exceptional items (£m) 0.9 (0.5) (5.7) (5.8) (0.4) 1.0 0.7 (0.2) (6.5) (7.2) (1.0) (11.5) 28.6% 150.0% (12.3)% (19.4)% (60.0)% (108.7)% • Reduction in group overheads • Exceptional items include • a gain of £3.9m in relation to previous acquisitions & disposals • a gain of £4.3m on sale of properties • a loss of £4.1m on exit from certain operations • expenses of £2.7m in relation to proposal to acquire certain businesses of, or merge with, National Express Group plc
Finance charges and credit ratios 31 Oct 09 31 Oct 08 Change Net Group finance charges (£m) Net finance charges, including net finance income from joint ventures (£m) EBITDA from continuing operations and joint ventures* (£m) • last six months • last twelve months Period-end net debt (£m) Net Debt/EBITDA (12 months)* EBITDA*/Net finance charges (including net finance income from joint ventures) (18.0) (17.9) 147.9 300.9 343.1 1.1x 8.3x (14.6) (13.0) 156.2 302.7 370.2 1.2x 12.0x 23.3% 37.7% (5.3)% (0.6)% (7.3)% (0.1)x (3.7)x * excluding exceptional items
Liquidity & interest rate risk • Excellent liquidity • c.£525.3m of undrawn committed bank facilities at 31 October 2009 • US$ bond redemption financed from existing facilities in November 2009 • Key refinancing required by 2012 • Other undrawn available credit lines – e.g. asset finance • Operating well within bank covenants • Encouraged by liquidity that was available to finance National Express opportunity • Cash generative • Planning for re-financing • Significantly higher margins for new UK asset finance • Likely step up in bank margins for refinancing • Debt capital markets offer longer maturities and reduced reliance on banks
Taxation 31 Oct 2009 Pre-tax Profit £m Tax £m Rate % Excluding intangible asset expenses and exceptional items - Before joint ventures - Joint ventures Intangible asset expenses Exceptional items Reclassify joint venture taxation for reporting purposes Reported in income statement 57.9 21.5 (5.7) 73.7 1.4 75.1 (3.9) 71.2 (11.1) (3.9) 0.9 (14.1) (0.4) (14.5) 3.9 (10.6) 19.2% 18.1% 15.8% 19.1% 19.3% 14.9% • Cash tax received was £10.6m
Movement in net debt 31 Oct 09 £m EBITDA from Group companies before exceptionals Loss on disposal of plant and equipment Equity-settled share based payment Dividends from joint ventures Movement in retirement benefit obligations Working capital movements Net interest paid Tax received Net cash from operating activities Net capital expenditure including new hire purchase and finance leases Acquisitions of businesses, intangibles and investments Disposals of businesses and investments Movement in loans to joint ventures Token sales and redemptions Cash generation Foreign exchange/other Equity dividends Increase in net debt Opening net debt Closing net debt • 126.5 • 0.8 • 2.2 • 16.3 • (7.9) • (53.0) • (17.5) • 10.6 • 78.0 • (71.6) • (1.0) • 1.6 • 1.6 • (1.1) • 7.5 • 19.6 • (30.1) • (3.0) • (340.1) • (343.1)
Capital expenditure New hire purchase and finance leases £m Impact of capex on net debt £m Disposal proceeds** £m Net £m Cash spent on capex* £m UK Bus North America UK Rail 33.2 1.9 Nil 35.1 53.7 12.1 21.6 87.4 (3.5) (0.6) (11.7) (15.8) 50.2 11.5 9.9 71.6 20.5 10.2 21.6 52.3 * Excludes capitalised intangible assets of £0.5m (2008: £3.1m) ** Excludes proceeds from selling businesses
Defined benefit pensions • At 31 October 2009, the Group’s accounting post-tax net deficit was £177.2m • Rail schemes represent around 40% of pension assets and liabilities and is low risk • The Group’s main scheme is closed to new members • The accounting value of pension assets, liabilities and costs will continue to vary with market fluctuations and assumptions • Cash contributions expected to be more stable
Fuel Hedging UK Bus North America UK Rail 2008/9 - average effective price (per litre) 2009/10 - % of forecast consumption hedged - average hedge price (per litre) 2010/11 - % of forecast consumption hedged - average hedge price (per litre) 2011/12 - % of forecast consumption hedged - average hedge price (per litre) Market price (per litre) 32.0p 96.0% 46.0p 95.0% 35.9p 10.0% 37.2p 32.1p 63.1 cents 89.0% 82.4 cents 84.0% 50.5 cents 11.0% 54.2 cents 52.2 cents 33.4p 77.0% 31.3p 76.0% 31.3p - - 31.5p Market prices are as at 20 November 2009 Prices excludes delivery margins, duty, taxes and Bus Services Operators’ Grant
Fuel costsLatest forecasts Fuel costs 2008/09 Actual £m 2009/10 Forecast £m 2010/11 Forecast £m 2011/12 Forecast £m UK Bus, excluding BSOG* UK Bus, BSOG* UK Bus, including BSOG* North America South Western Trains East Midlands Trains Total (176.4) 75.9 (100.5) (32.8) (5.4) (20.0) (158.7) (202.3) 79.2 (123.1) (37.3) (5.0) (21.1) (186.5) (183.6) 78.3 (105.3) (27.9) (5.1) (21.4) (159.7) (179.4) 78.3 (101.1) (30.0) (5.1) (21.5) (157.7) Market prices are as at 20 November 2009, when Brent Crude was US$76 per barrel Forecast costs for the unhedged element of fuel are based on 20 November 2009 spot prices Above costs include delivery margins, duty and taxes (duty forecast at current levels) and exclude 3rd party fuel costs * Bus Services Operators Grant (“BSOG”) represents a rebate of an element of fuel duty costs in respect of certain UK Bus Services
Overview • Good performance despite downturn and step-up in costs • UK businesses - revenue growth ahead of inflation • Bus businesses - resilient and flexible business model • Management action to protect UK Rail business for the long-term • Excellent operational performance
UK Bus • Resilient, flexible business model • Managed £12.6m in extra fuel and pensions costs • Strong industry-leading operating margin • Stable passenger volumes • Stable mileage • Sustained investment
UK Rail • Focus on managing rail contracts • Revenue growth despite downturn • Early signs of improvement • Cost reduction programme • £70m recurring annual savings identified • Maintained excellent operational performance • Positive engagement with Department for Transport • South Western Trains contractual issues • Specific issues • Clear timeframe for resolution by April 2010
North America • High unemployment levels impacting revenue • Decisive management action to reduce operating mileage and costs • Growth and further potential of megabus.com • Online bus sales – up 24% on 2008 • Twin America joint venture positive development for New York sightseeing business
Current trading and outlook • Current trading in line with management expectations • Balanced portfolio and resilient bus business • New, lean low cost rail model • Positive outlook for 2010/11 • Reduced fuel costs • Entitlement to revenue support at South Western Trains • Pricing • Good shape for economic recovery
Interim ResultsFor the six months ended 31 October 20099 December 2009
UK Bus Revenue 31 Oct 2009 £m 31 Oct 2008 £m Change % Like-for-like Acquisitions: Highland excluding Inverness (acquired 16 May 2008) Preston Bus (acquired 23 January 2009) Eastbourne/Cavendish (acquired 18 December 2008) Stagecoach in Inverness* Start-ups: Rail replacement (started May 2008) Total reported 417.3 3.9 3.3 3.2 4.4 0.9 433.0 399.9 4.4 - - 3.7 2.4 410.4 4.4% 5.5% * Existing Inverness operations integrated with and now not distinguishable from Highland so Inverness excluded from like-for-like comparison
North America revenue breakdown 31 Oct 09 US$m 31 Oct 08 US$m % Growth 95.2 50.7 39.8 14.4 200.1 1.2 201.3 20.1 221.4 103.5 56.8 43.9 16.0 220.2 47.5 267.7 15.4 283.1 (8.0)% (10.7)% (9.3)% (10.0)% (9.1)% (97.5)% (24.8)% 30.5% (21.8)% Scheduled service/line run/commuter Charter School bus & contract Sightseeing & tour Like-for-like revenue excl megabus Closed/transferred operations and foreign exchange movements Total North America excl megabus megabus Total North America
Divisional income statements Six months ended 31 October 2009 UK Bus £m North America £m UK Rail £m VRG (100%) £m 433.0 Nil 6.4 (219.1) (62.3) (15.7) (26.1) Nil (5.2) Nil Nil Nil (17.1) (35.0) 58.9 136.6 Nil 1.6 (58.6) (20.2) (9.3) (9.8) Nil (3.0) Nil Nil Nil (9.6) (19.4) 8.3 512.9 (50.4) 34.6 (130.1) (15.4) (2.6) (14.7) (94.4) (2.3) (110.2) (19.4) (11.2) (31.8) (50.1) 14.9 347.8 (36.3) 60.0 (67.1) (9.0) (1.4) (0.7) (105.4) Nil (77.1) (20.2) (22.4) Nil (42.0) 26.2 Revenue Rail franchise premia Other operating income (including revenue support) Staff costs Fuel costs (i.e. diesel) Insurance and claims costs Depreciation and impairment Rolling stock costs – lease & maintenance Other operating leases Network Rail Electricity for trains Commissions payable Material & consumables Other costs Operating profit
Rail subsidy/(premia) profiles South Western £m East Midlands £m West Coast £m Year to 31 March: 2009 2010 2011 2012 2013 2014 2015 2016 2017 21.1 (42.0) (96.3) (158.3) (228.1) (292.9) (357.7) (432.1) (429.4) 121.7 96.9 61.0 17.8 (13.5) (32.4) (87.9) - - 288.2 277.2 226.3 190.0 - - - - - The above amounts are subject to adjustment for: (1) various inflation measures (2) risks borne by the Department for Transport (3) called options and (4) changes in Regulated Network Rail charges. The amounts shown above are based on estimated inflation and options called to date. The amounts shown above do not reflect changes arising from changes to Network Rail charges for Control Period 4, which began on 1 April 2009, because these charges are not yet finalised.
Exchange rates October 2009 October 2008 Closing rate Average rate Closing rate Average rate US$ C$ 1.6484 1.7756 1.6207 1.7885 1.6158 1.9645 1.8811 1.9767
Interim ResultsFor the six months ended 31 October 20099 December 2009